Notes
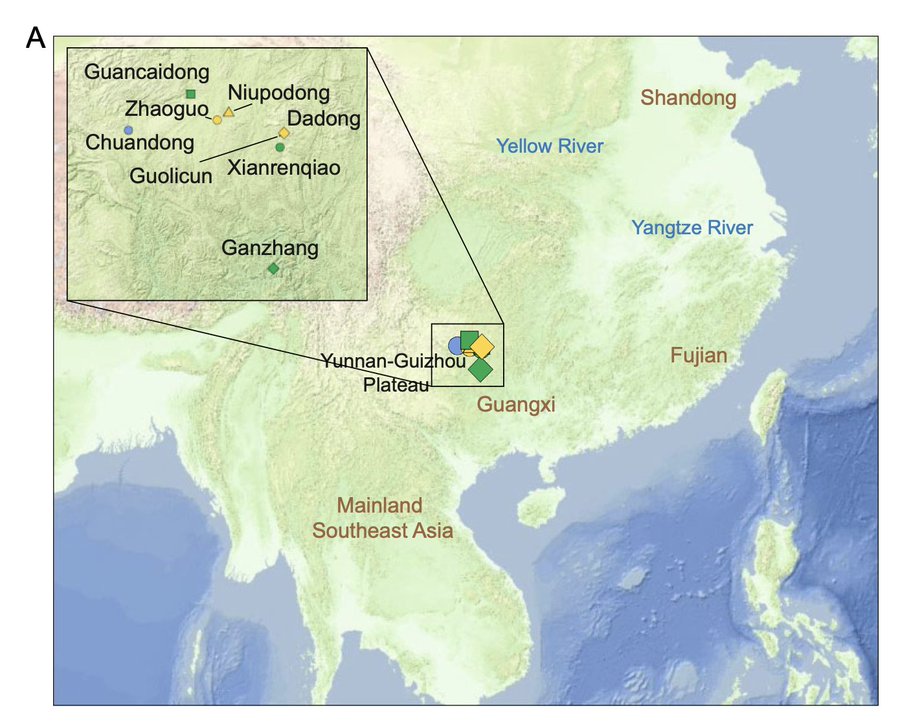
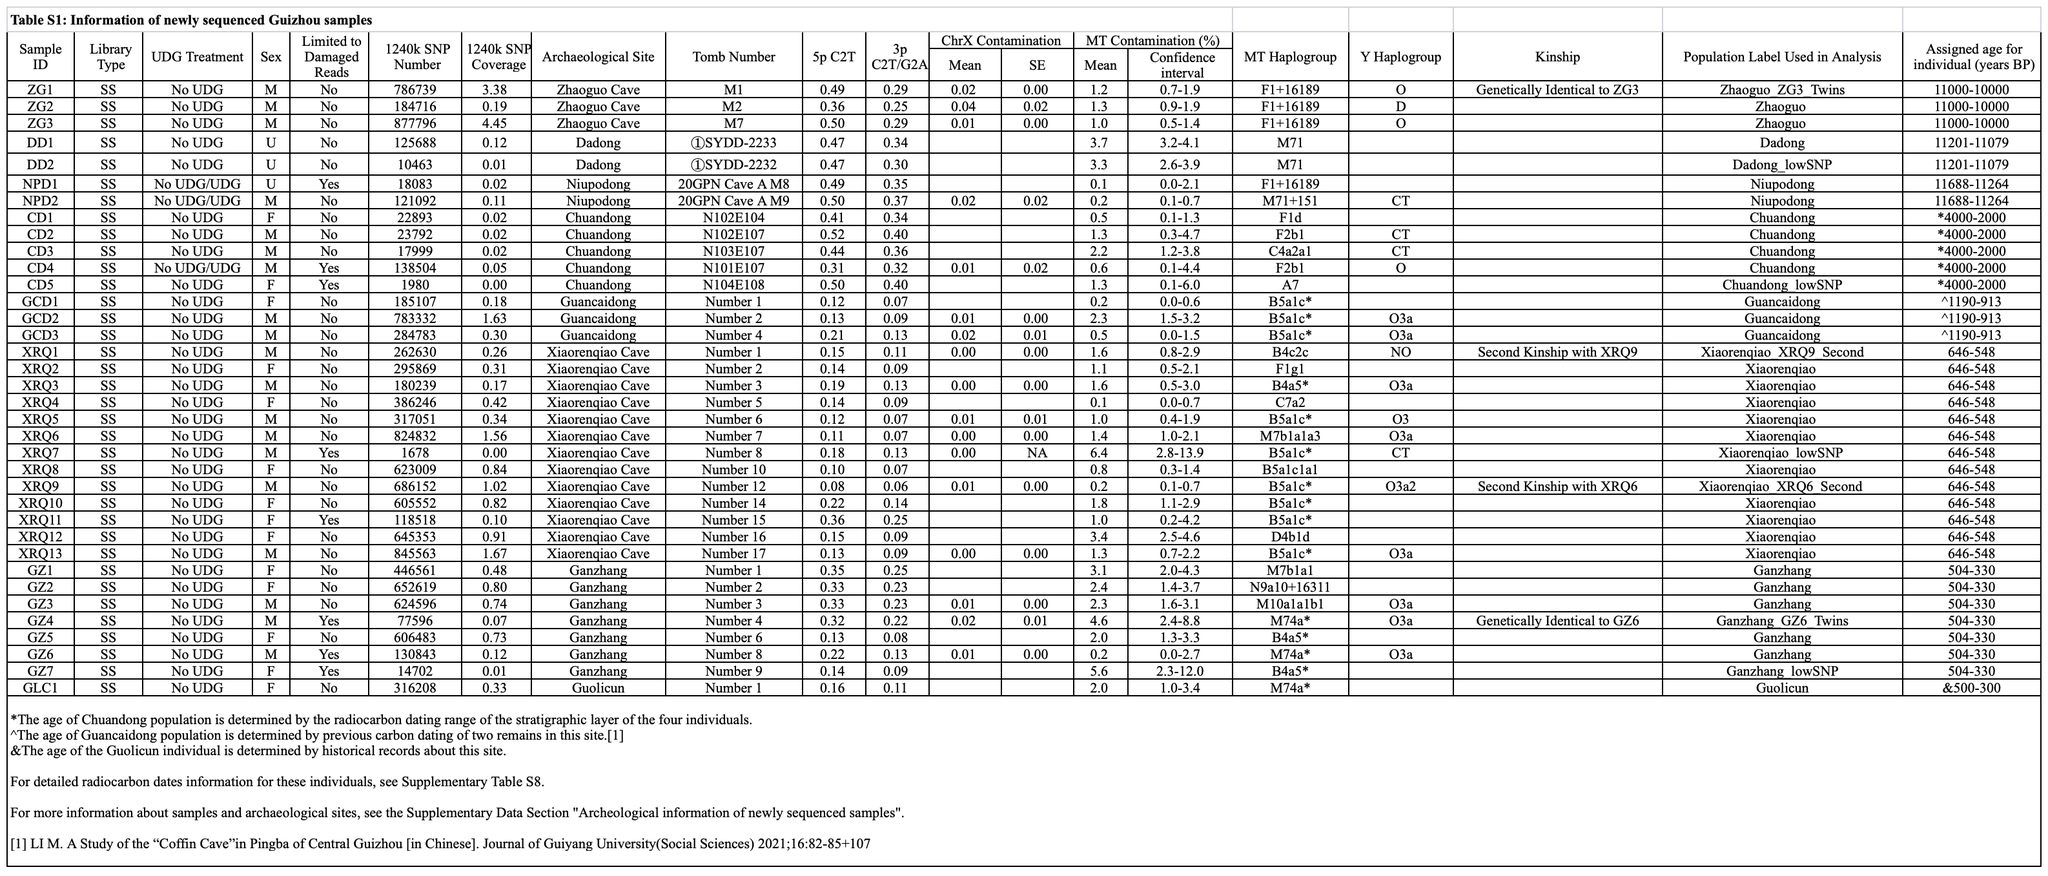
The big breakthrough is here at last. Fu Qiaomei’s team has obtained several >10,000-year-old ancient samples from Guizhou via the latest ancient DNA sequencing. Unfortunately, the resolution of the sequencing is relatively low. Among them, ZhaoguoM2 carries Y-chromosome haplogroup D and mitochondrial haplogroup F1. It remains unclear which subclade this D lineage belongs to. The paper states that ZhaoguoM1 and ZhaoguoM2 share more genetic drift. Admixture had already occurred in the Paleolithic DO population, which is consistent with the predictions of my hypothesis.
Paper: Paleogenomics retraces the ancient population history of Southwestern East Asia for the past 12 000 years
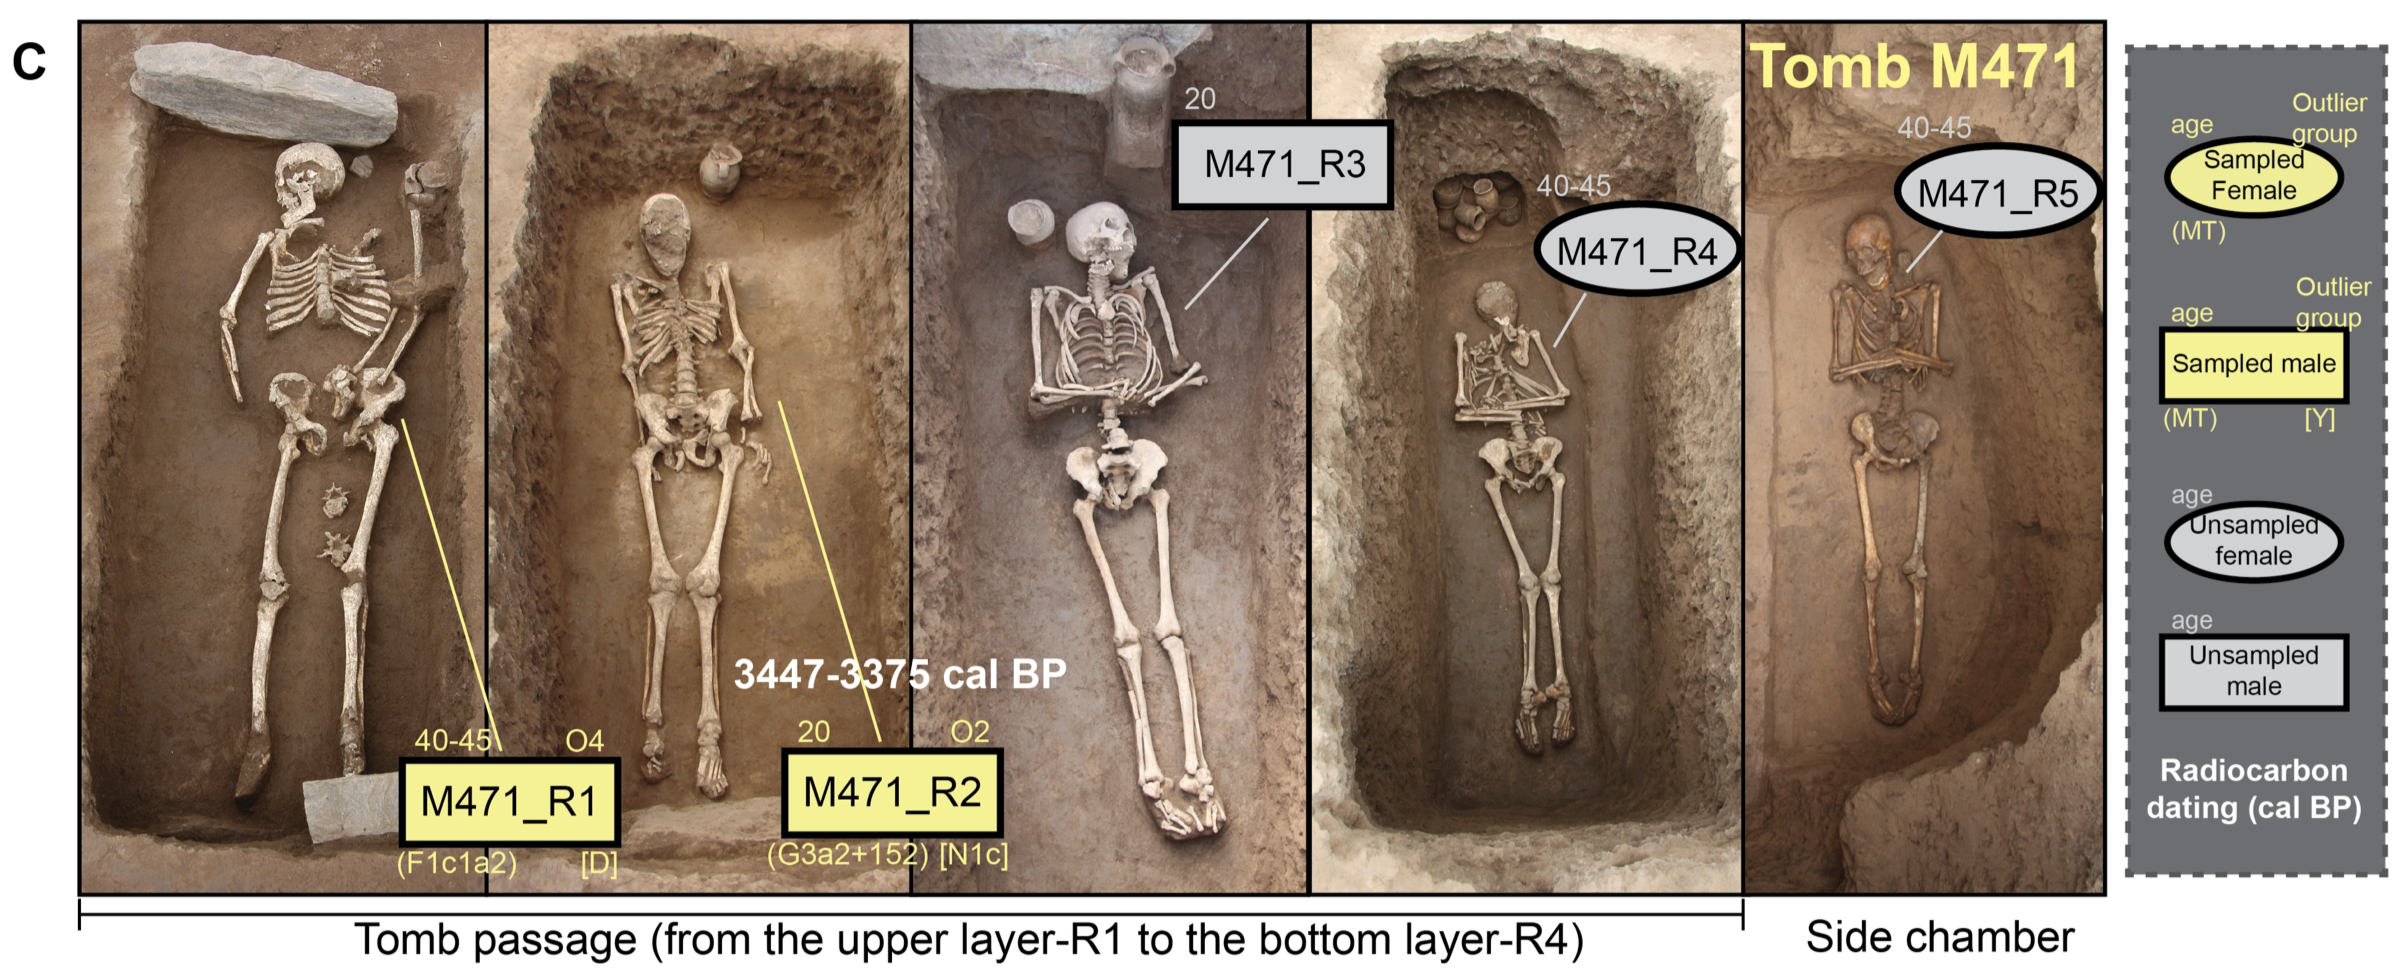
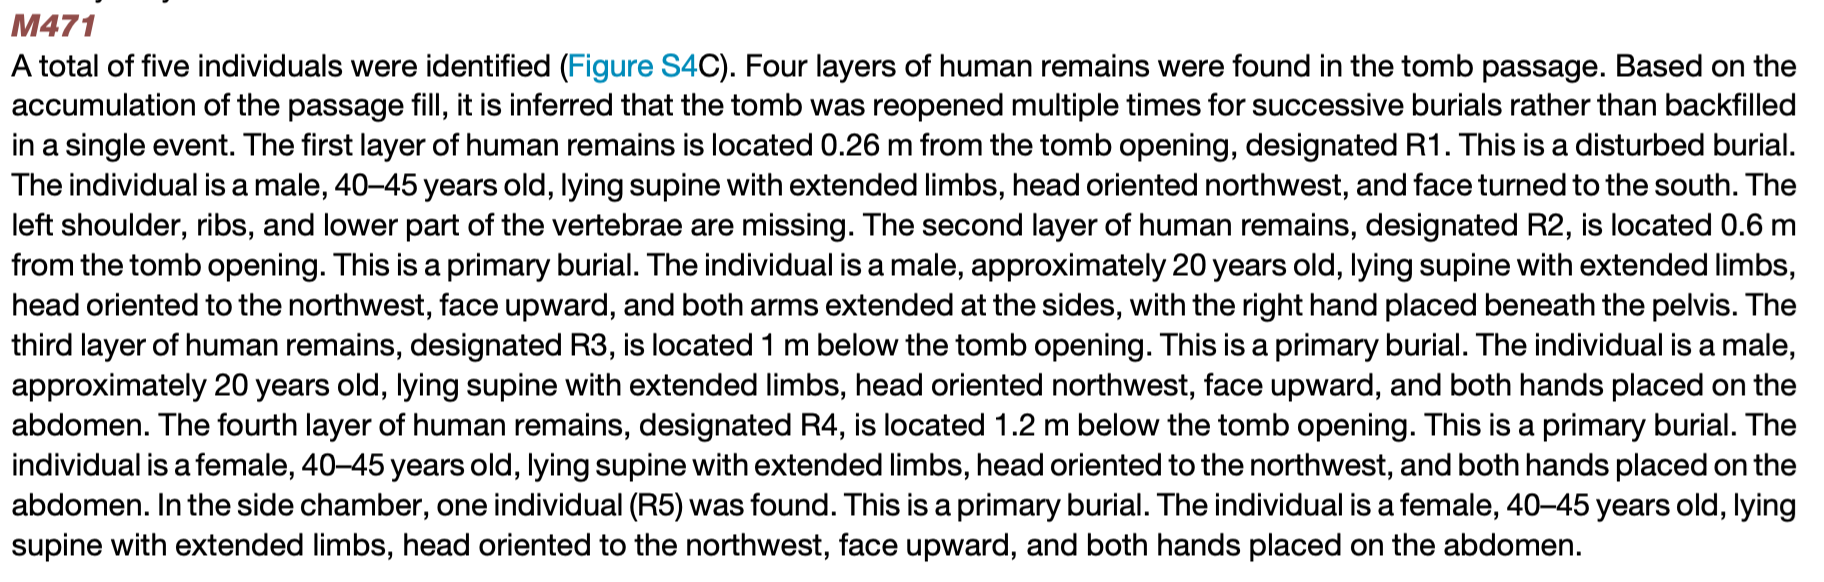
Tomb M471 at the Mogou site yielded a total of five individuals. Among them, sample MogouM471_R1 is a male aged 40‑45 years, belonging to Y‑chromosome haplogroup D‑Z31629 and mitochondrial haplogroup F1c1a2. Deposited in the uppermost layer of Tomb M471, he was laid supine with extended limbs, head oriented northwest and face turned south. Archaeological observations suggest that the tomb was repeatedly reopened for successive interments, implying that MogouM471_R1 represents a relatively late burial. Another interpretive possibility arises from the documentation of MogouM471_R1 as a disturbed burial. According to burial customs of the Qiaoyue culture, the skeleton of the primary tomb occupant would undergo ritual secondary disturbance, resulting in disarticulated and displaced bones, whereas the skeletons of sacrificial individuals within the same tomb commonly remained undisturbed and anatomically intact. This gives rise to a second hypothesis: MogouM471_R2, MogouM471_R3, MogouM471_R4 and MogouM471_R5 might have been sacrificial companions of MogouM471_R1. No definitive conclusion has yet been put forward in the published paper.
Paper: Genomics and social practices at Mogou and other Gansu sites during prehistoric trans-Eurasian exchange
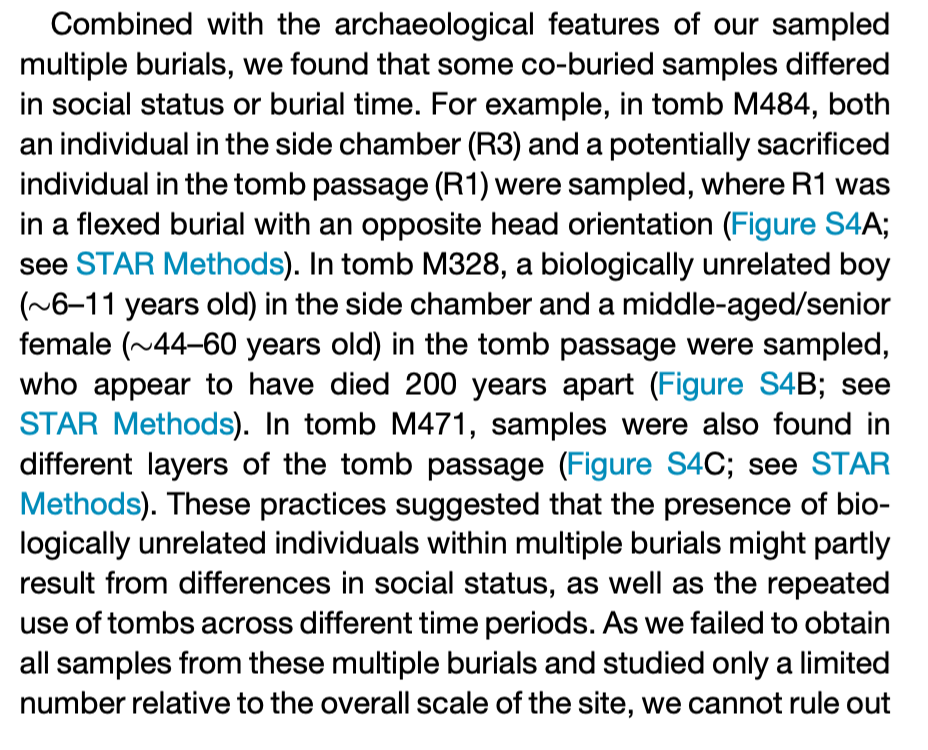
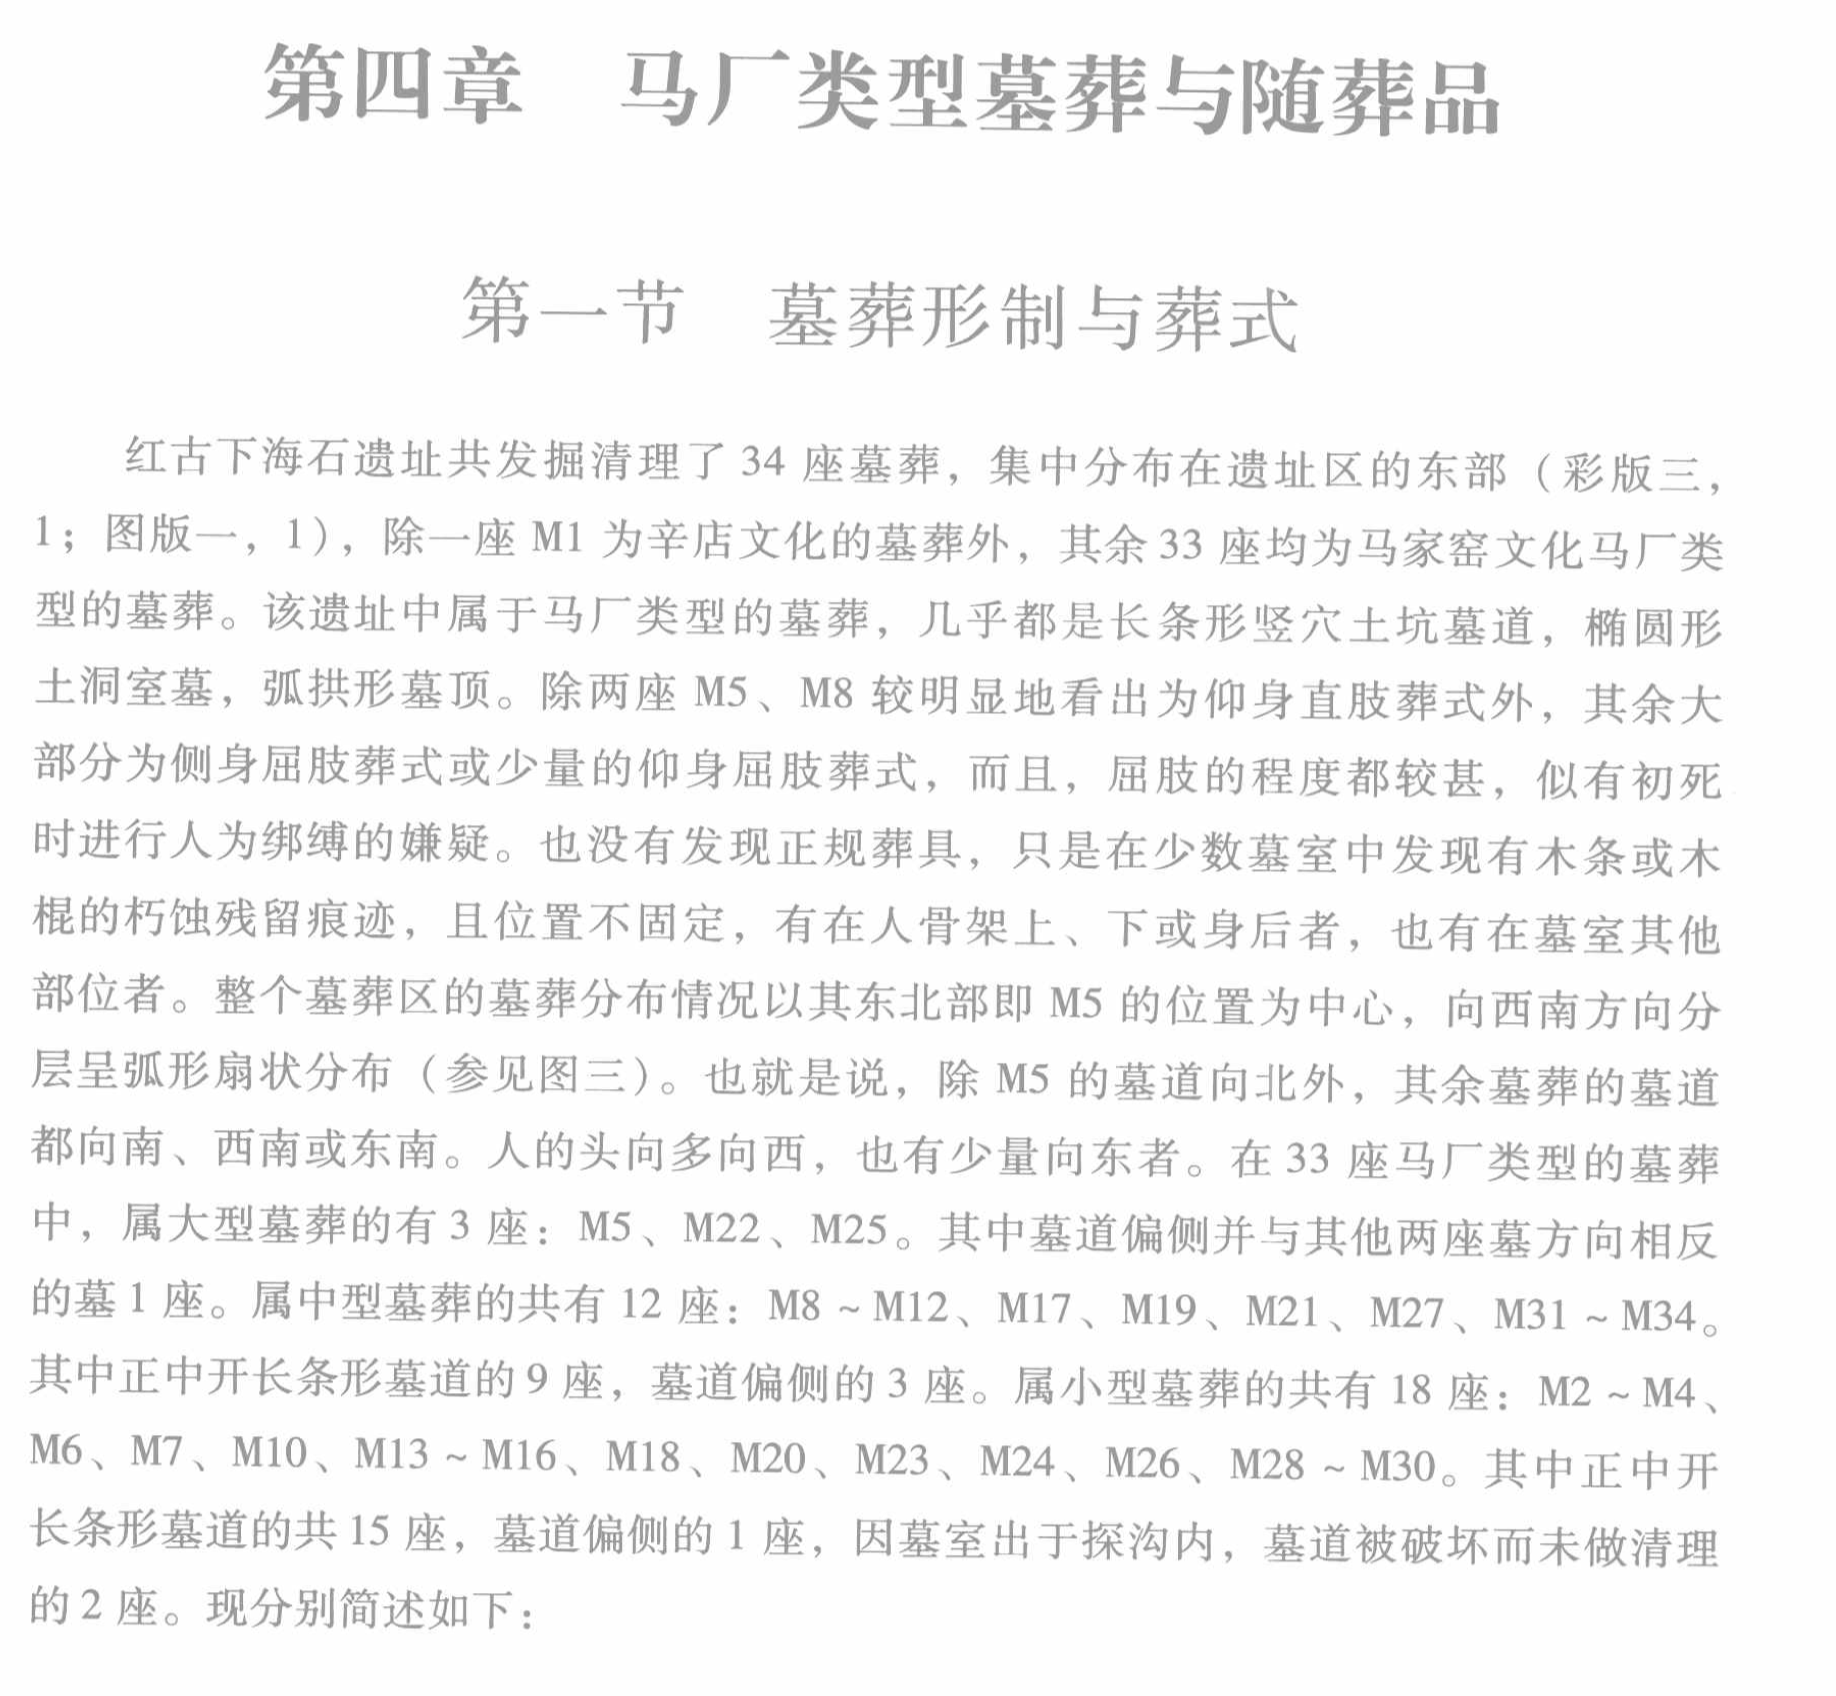
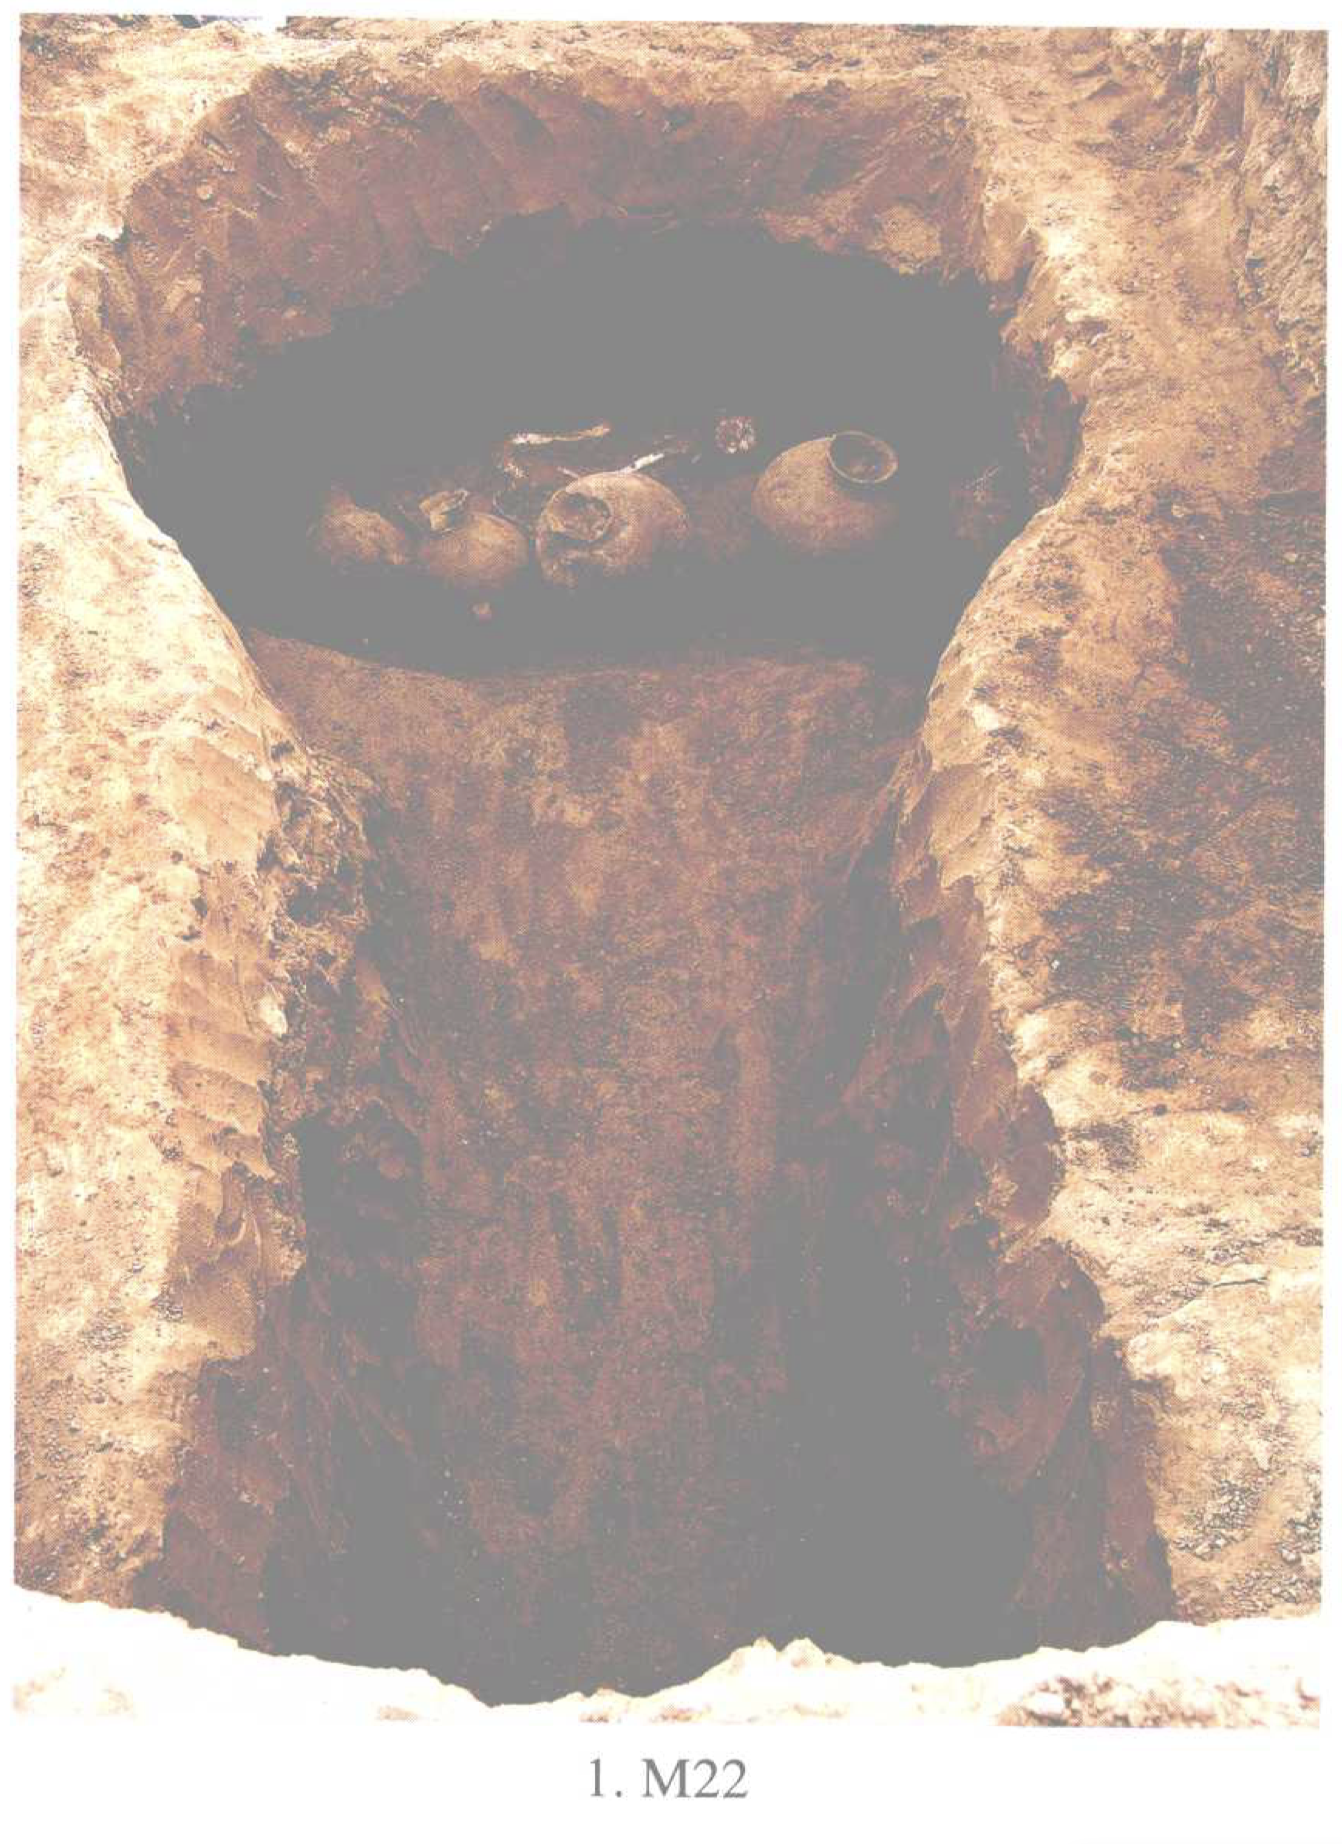
In the latest major study on Gansu, the Xiahaishi M22 sample belongs to paternal haplogroup D‑TY12221 and maternal haplogroup F2g. According to Excavation Report of the Neolithic Site at Xiahaishi, Honggu District, Lanzhou (《兰州红古下海石:新石器时代遗址发掘报告》), a total of 34 tombs were unearthed at the Xiahaishi site (下海石遗址). Except for Tomb M1, which is attributed to the Xindian culture, the remaining 33 tombs belong to the Machang phase of the Majiayao culture.
Among these 33 Machang‑culture burials, archaeologists formally classified the graves into three tiers: large‑scale, medium‑scale and small‑scale tombs. Three tombs are categorized as large‑scale: M5, M22 and M25. Xiahaishi M22 is therefore one of the three large tombs at the site, and it contained the burial of a male individual aged approximately 45 years.
Paper: Genomics and social practices at Mogou and other Gansu sites during prehistoric trans‑Eurasian exchange
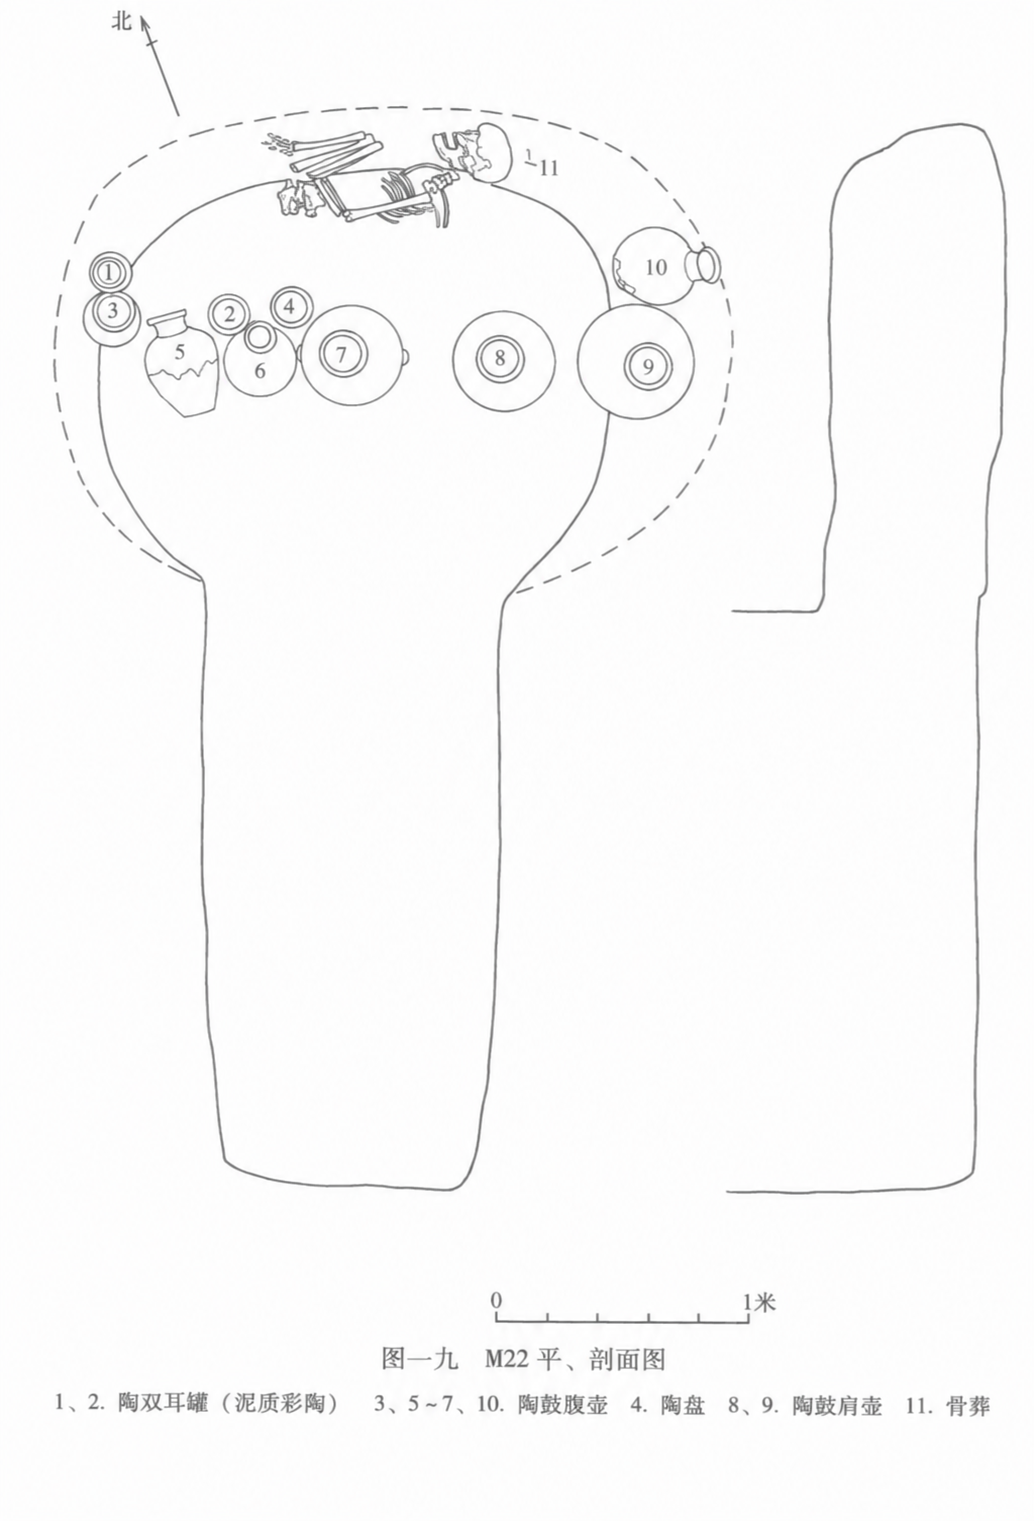
Isotopic evidence for Li Xuan, Emperor Xizong of Tang—the 19th emperor of the Tang Dynasty—suggests that his diet in later life relied heavily on cultivated crops such as wheat, with low intake of animal protein. Nevertheless, research priority lies in analyzing the non-recombining region of the Y chromosome, a task that entails greater technical difficulty and thus may require additional time to complete.
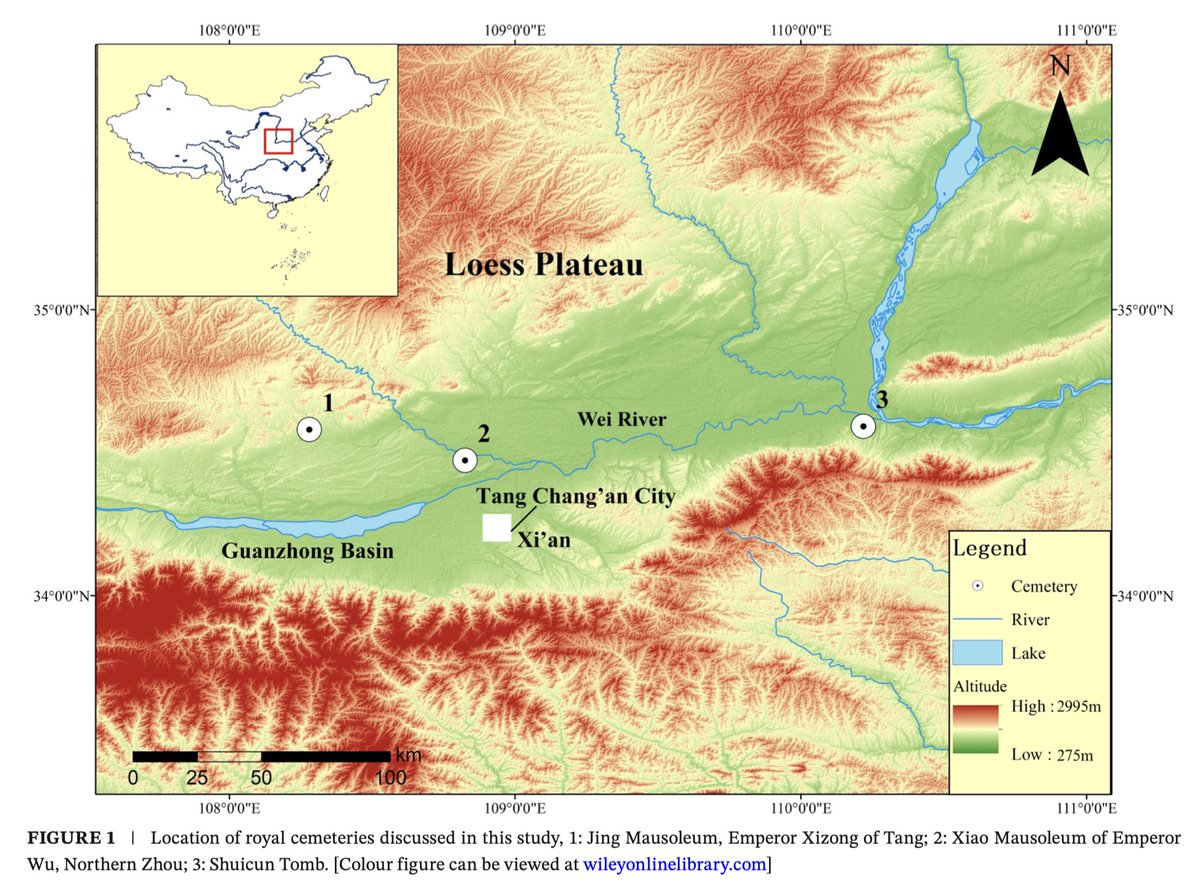
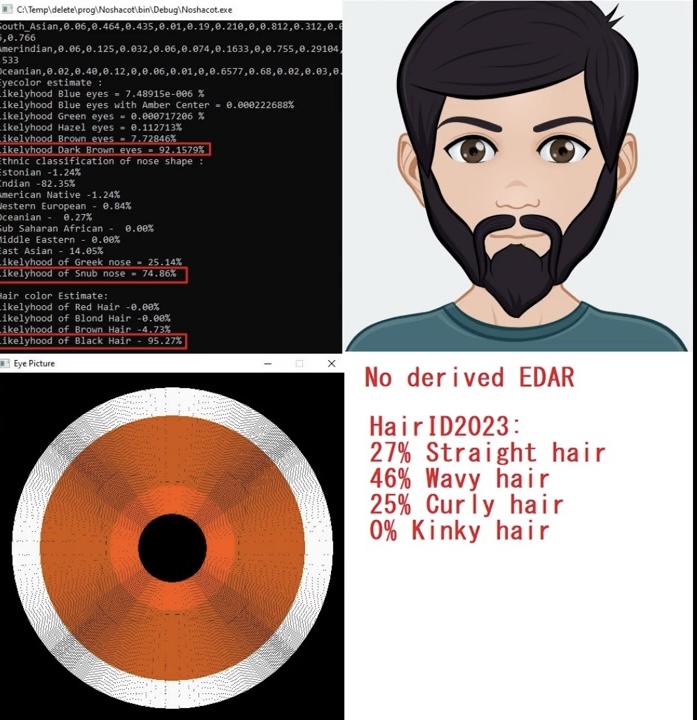
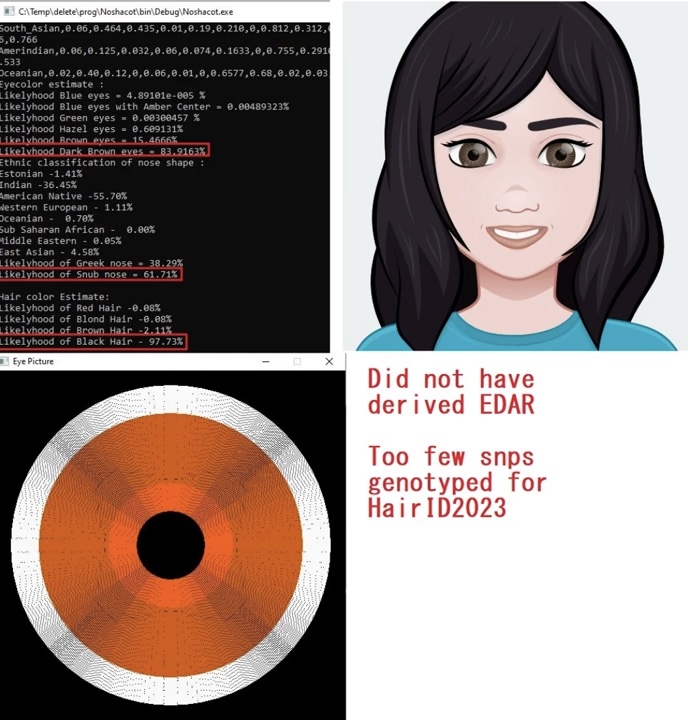
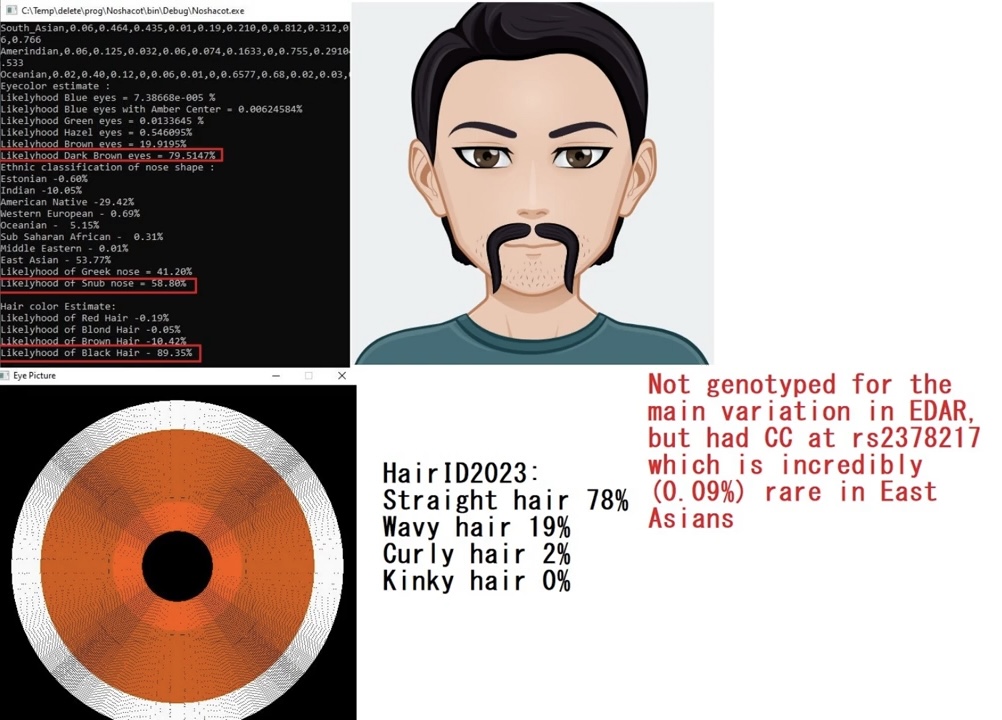
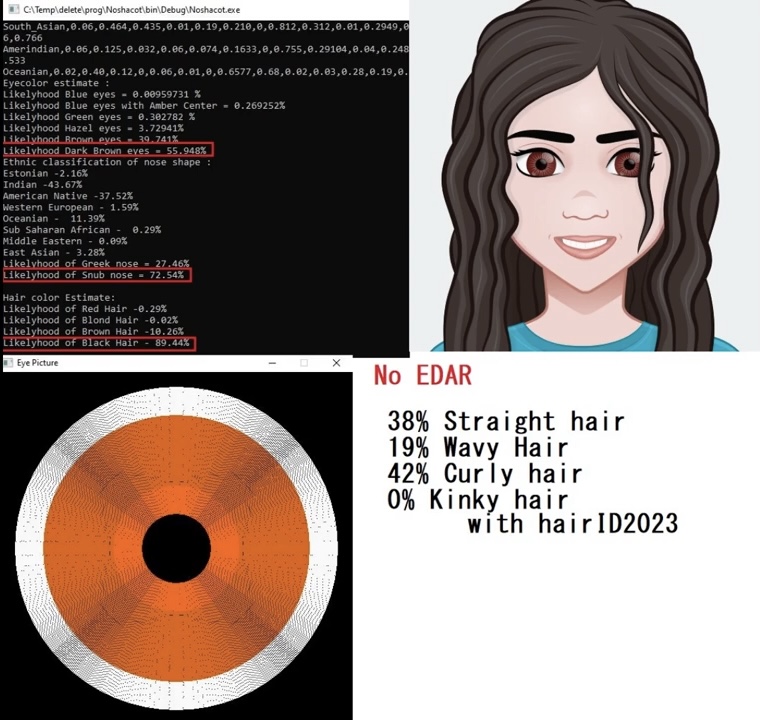
This is about the YouTube video DNA + Appearance of Jomon Hunter Gatherers (4 Jomon Individuals). The blogger Andre analyzed the ancient DNA of four Jomon individuals, which included the D1a2 paternal lineage and N9b maternal lineage. First of all, none of them carried the EDAR mutation, and they had wavy hair. Below are the key segments of the video:
- 4:17: A male Jomon individual with D1a2 lineage was found to carry a genotype of the dopamine D2 receptor that is rare among East Asians but prevalent in Europeans; this individual also suffered from leukoplakia verrucosa.
- 7:30: A female Jomon individual with N9b lineage was detected to have the warrior with the lE genotype. This genotype is extremely uncommon in East Asia but common in Europe, and it is associated with slow dopamine response, which implies better attention span and memory.
- 9:46: The fourth male Jomon individual can be described as having very fair skin or Caucasoid features.
- 11:44: Analysis via K23b indicated that this individual had 44% non-East Asian ancestry.
- 12:00: These Jomon individuals were not purely East Eurasian; they also had 10% West Eurasian ancestry.
- 12:10: They carried 5.5% Natufian ancestry (Natufian/IVC ancestry).
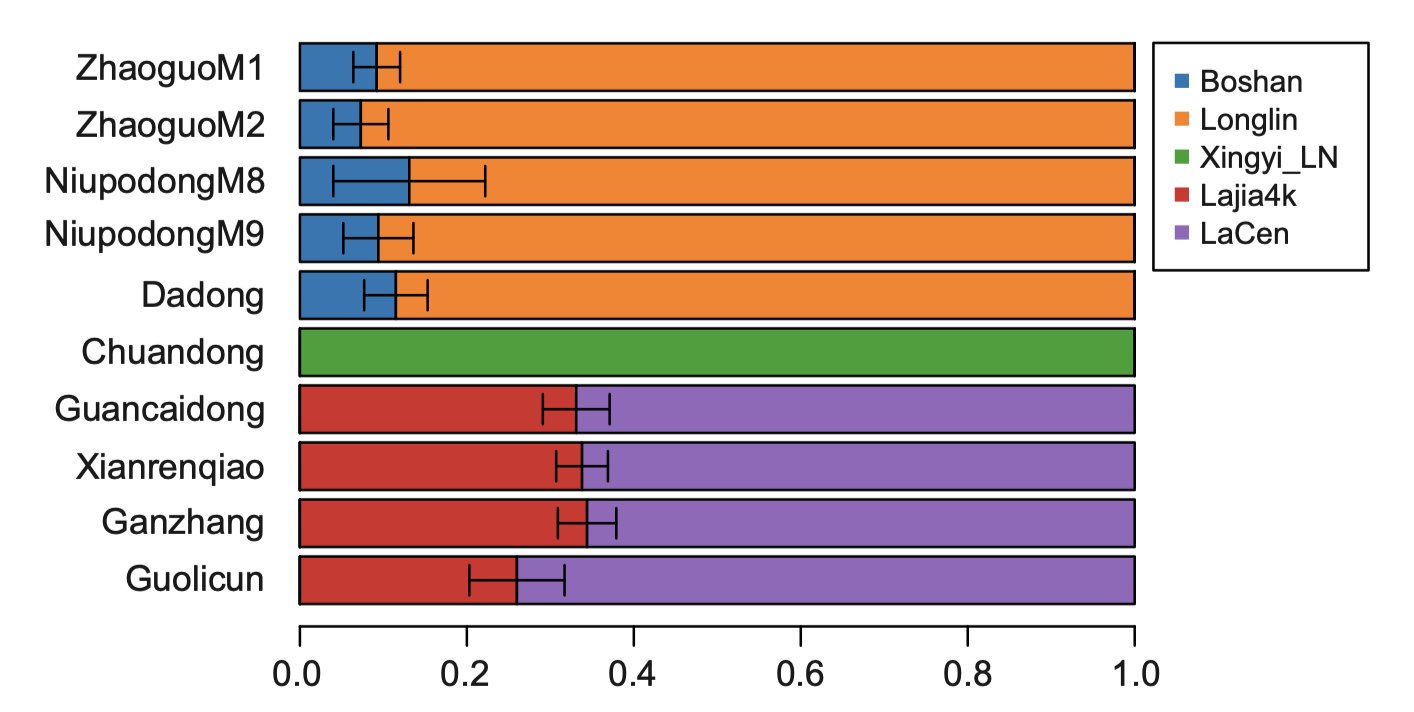
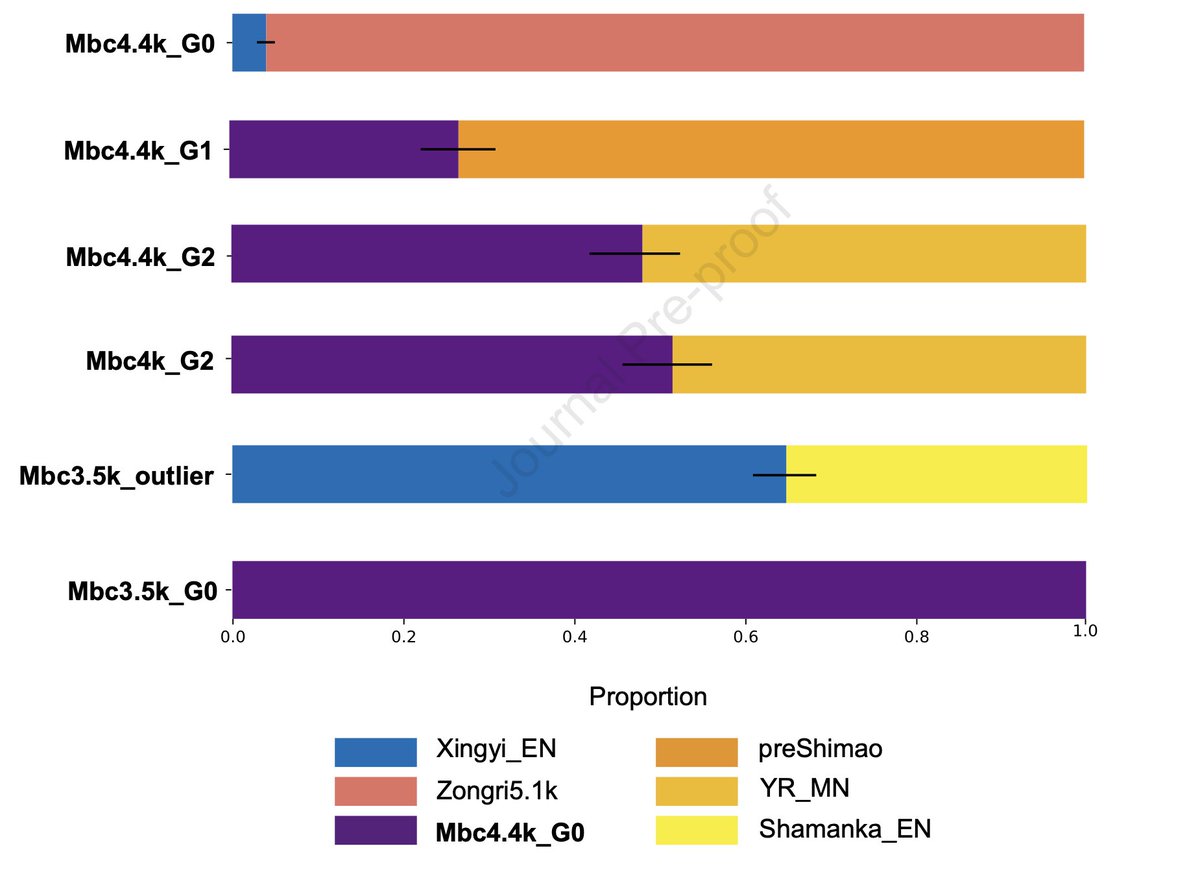
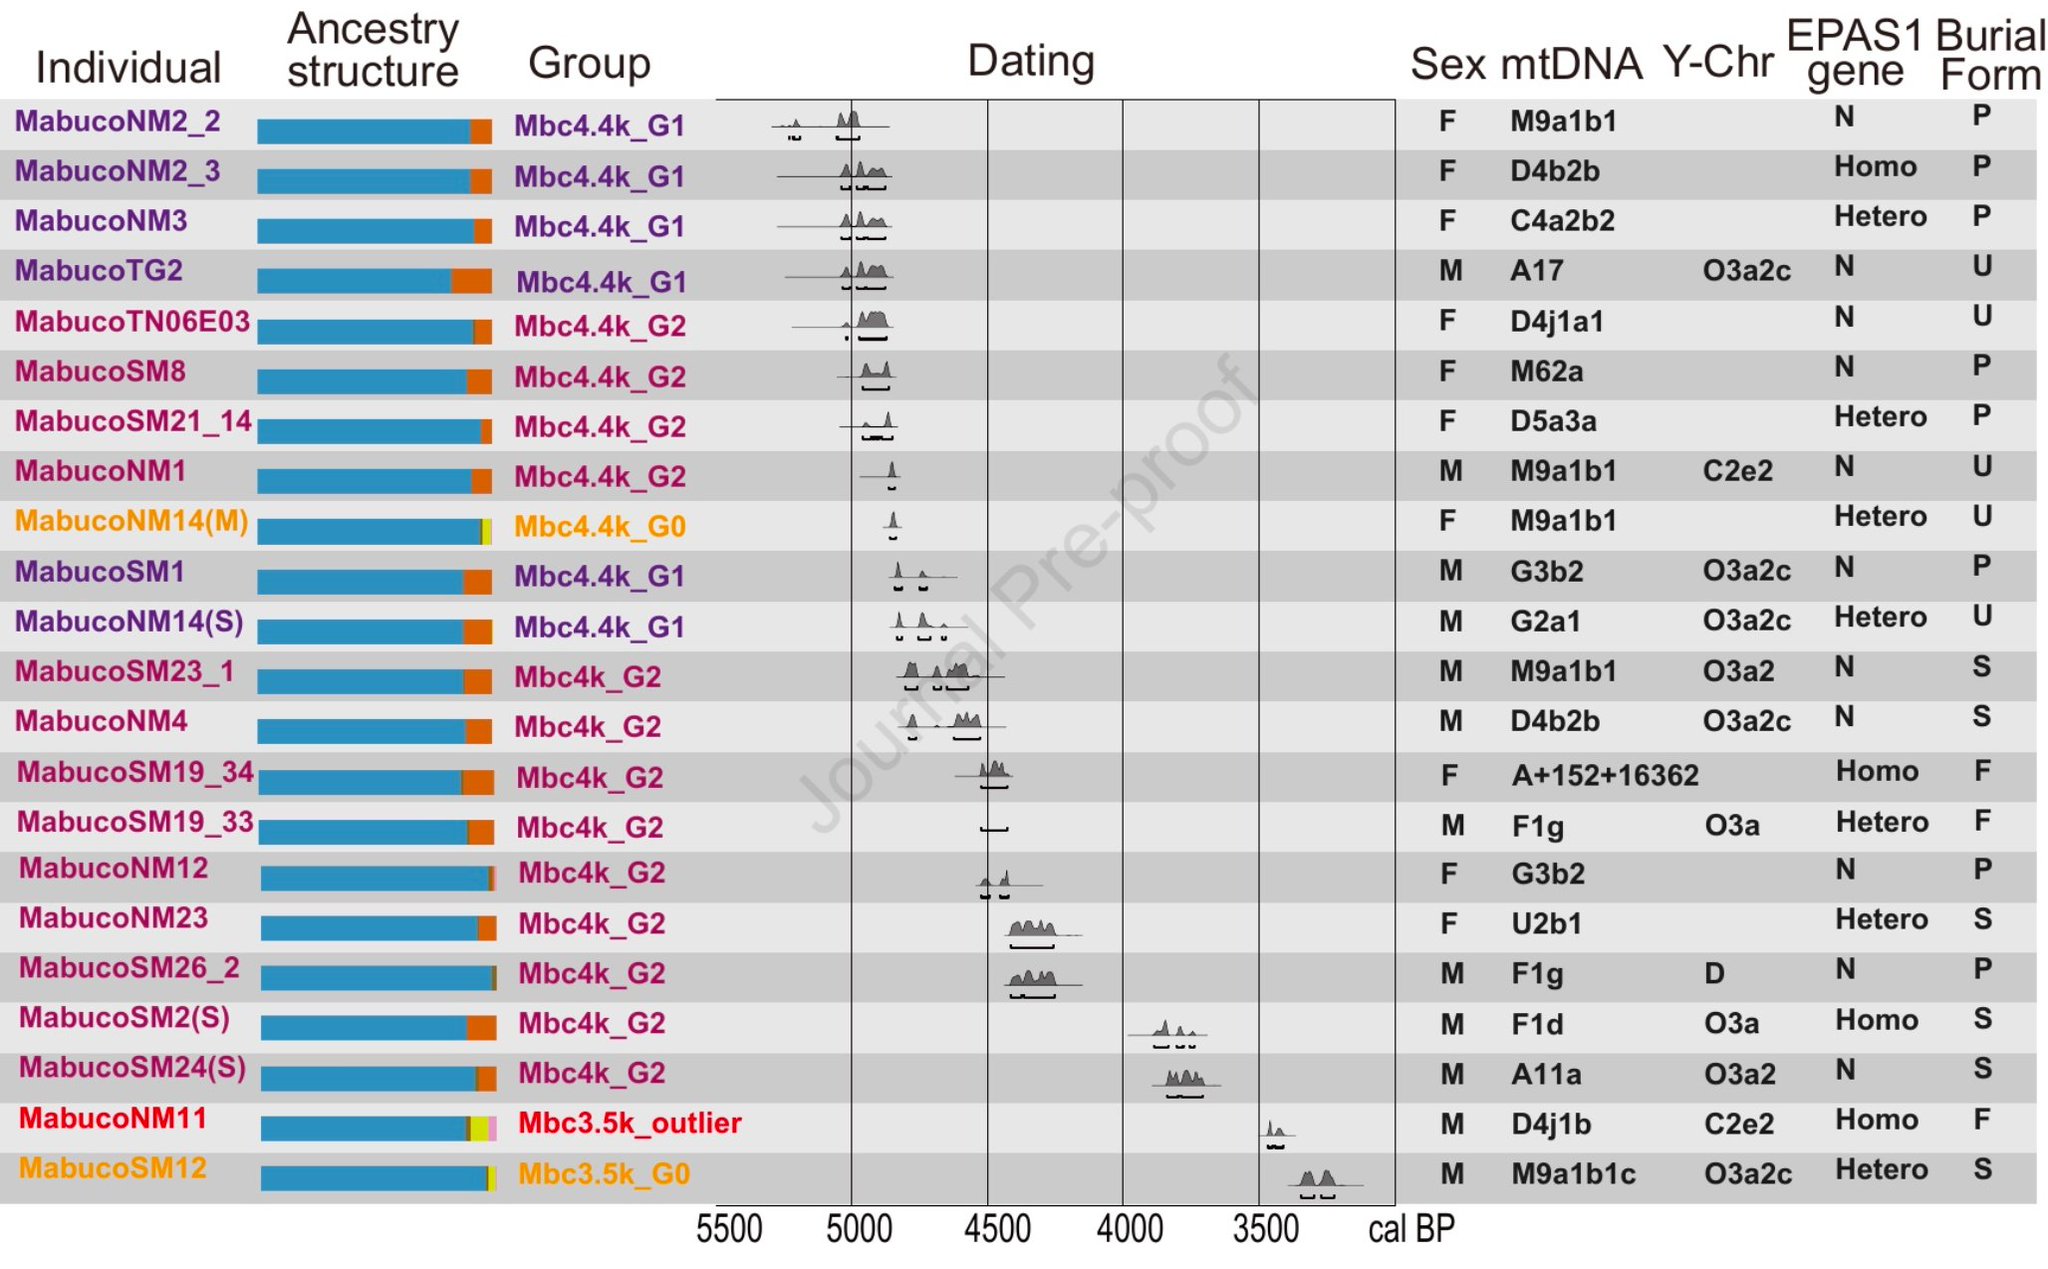
To date, apart from ancient Longlin individuals from Guangxi, another ancient specimen with substantial Xingyi_EN ancestry was identified via genomic analysis of human remains from the Mabu Co site in southern Tibet, reported in a September 2025 study.
One late-period individual designated Mbc3.5k_outlier in this research displays markedly exotic genetic ancestry, which can be modelled as a genetic composition comprising 60% Xingyi_EN and 40% Northern East Asian ancestry. This individual’s paternal haplogroup is C2e2(Old nomenclature; no matching entries found in the ISOGG database)and maternal haplogroup D4j1b.
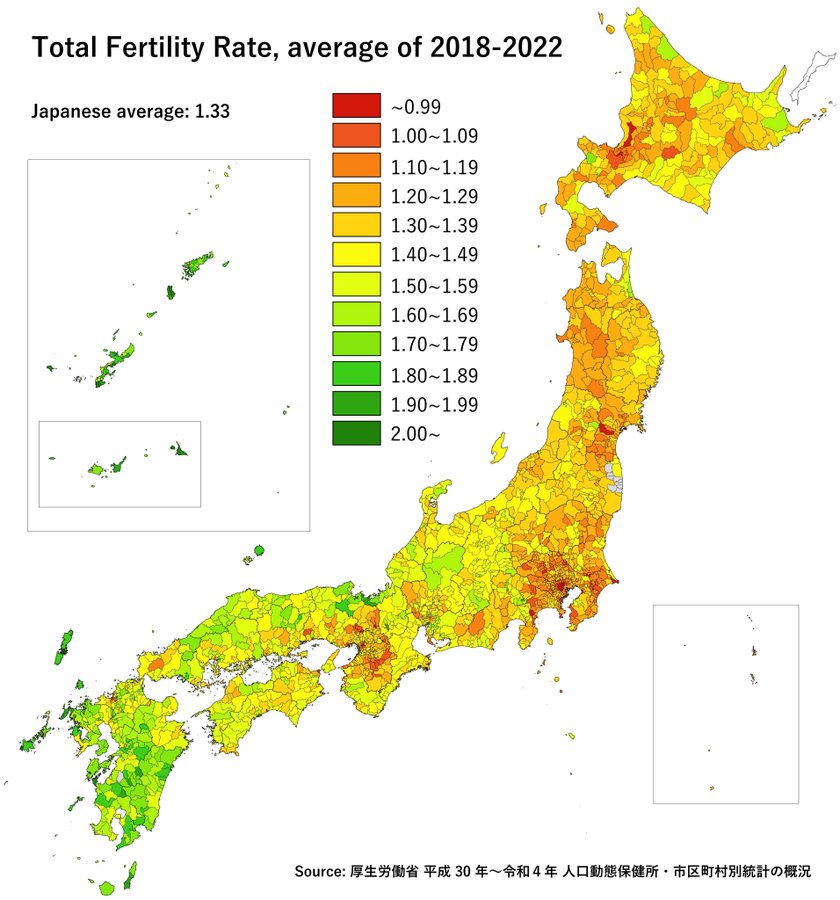
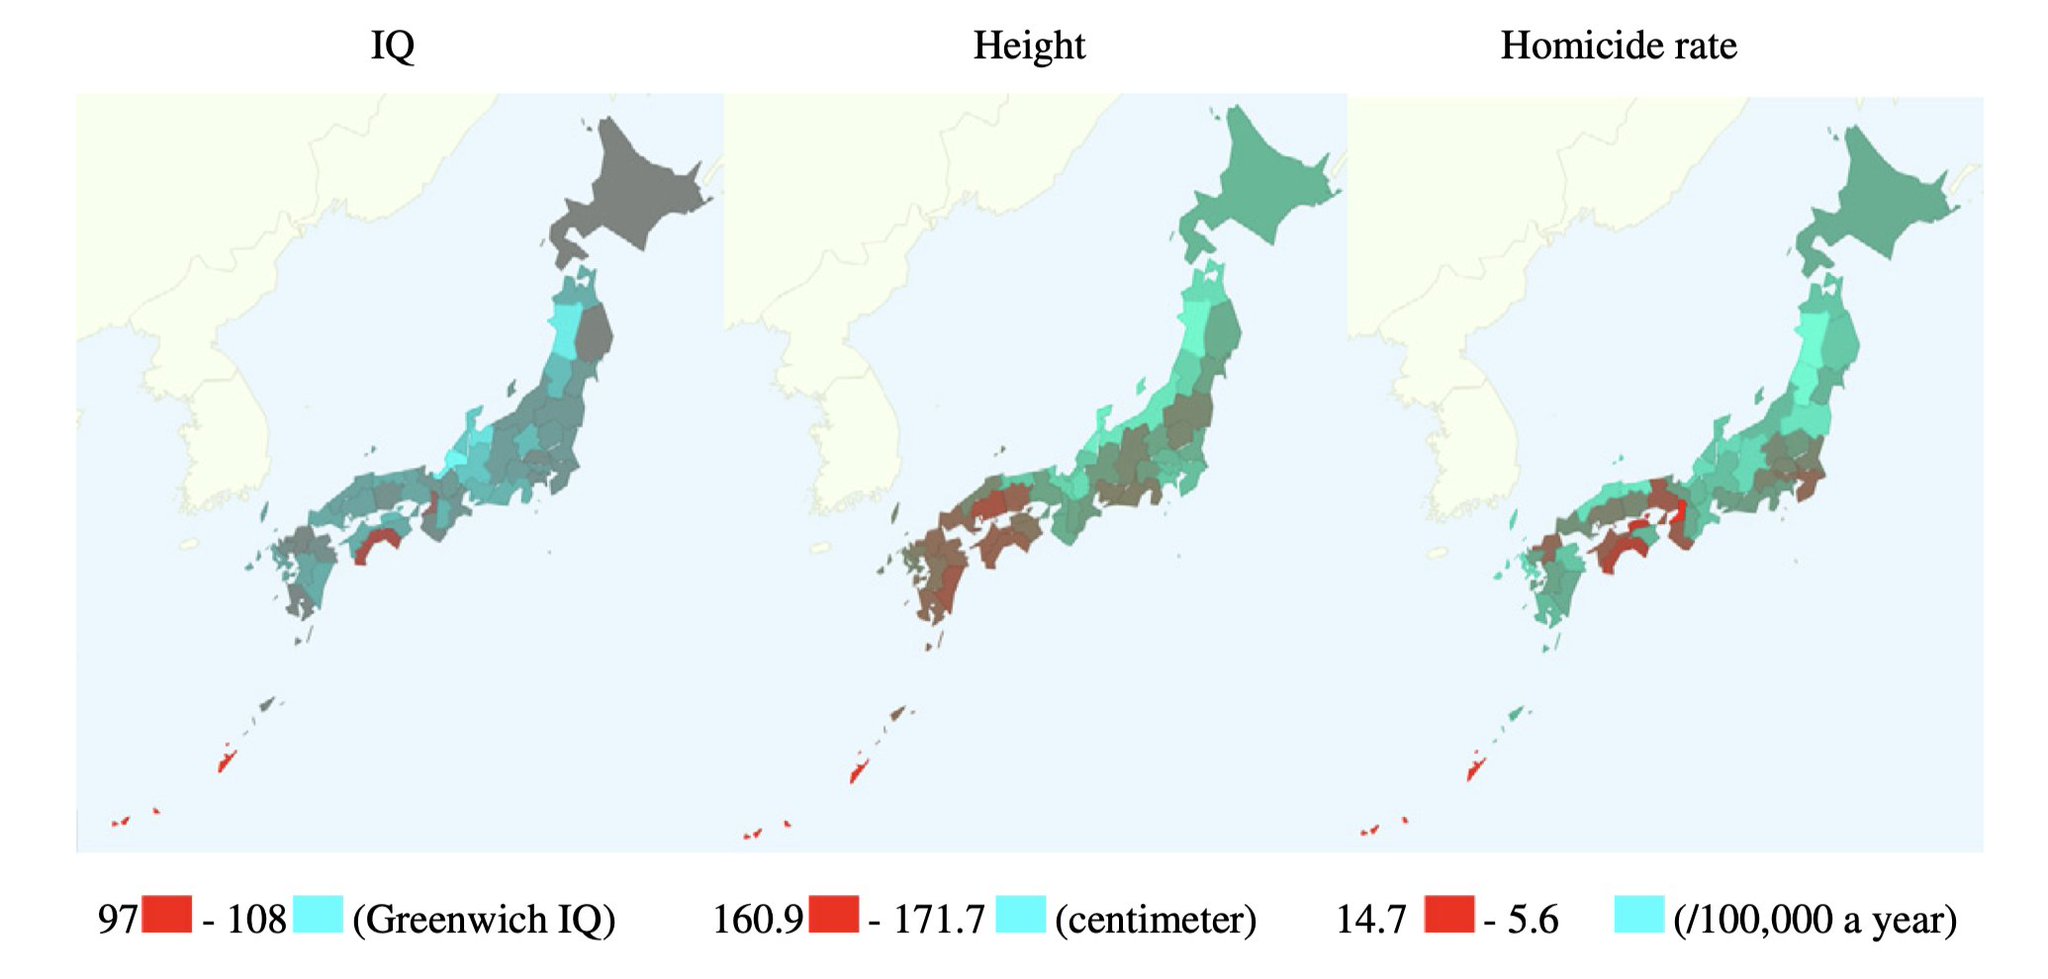
Overall, populations living in northern Japan are taller, more intelligent, and have lower crime rates, as well as lower divorce rates. However, they also exhibit lower fertility rates. Northern regions generally score higher in intelligence, height, and skin fairness, while southern regions (especially Okinawa) show relatively lower levels. The correlation coefficients of latitude with height, intelligence, and skin color are r = 0.70, 0.44, and 0.47, respectively.
The Hokuriku region in central Japan (Toyama, Ishikawa, Fukui) and the Kyoto–Osaka area in the Kinki region have the highest intelligence levels in Japan. Hokkaido in northern Japan shows relatively low intelligence, ranking at the lower‑middle level nationwide. Parts of Shikoku and Kyushu are among the regions with the lowest intelligence levels in the country.
Regions with the highest crime rates in Japan are concentrated in Shikoku, Kyushu, and parts of the Kinki region, with Tokushima and Kochi Prefectures in Shikoku being particularly prominent. Height shows a weak positive correlation with intelligence (taller regions tend to have higher intelligence), and a weak negative correlation with homicide rates (shorter regions tend to have higher homicide rates).
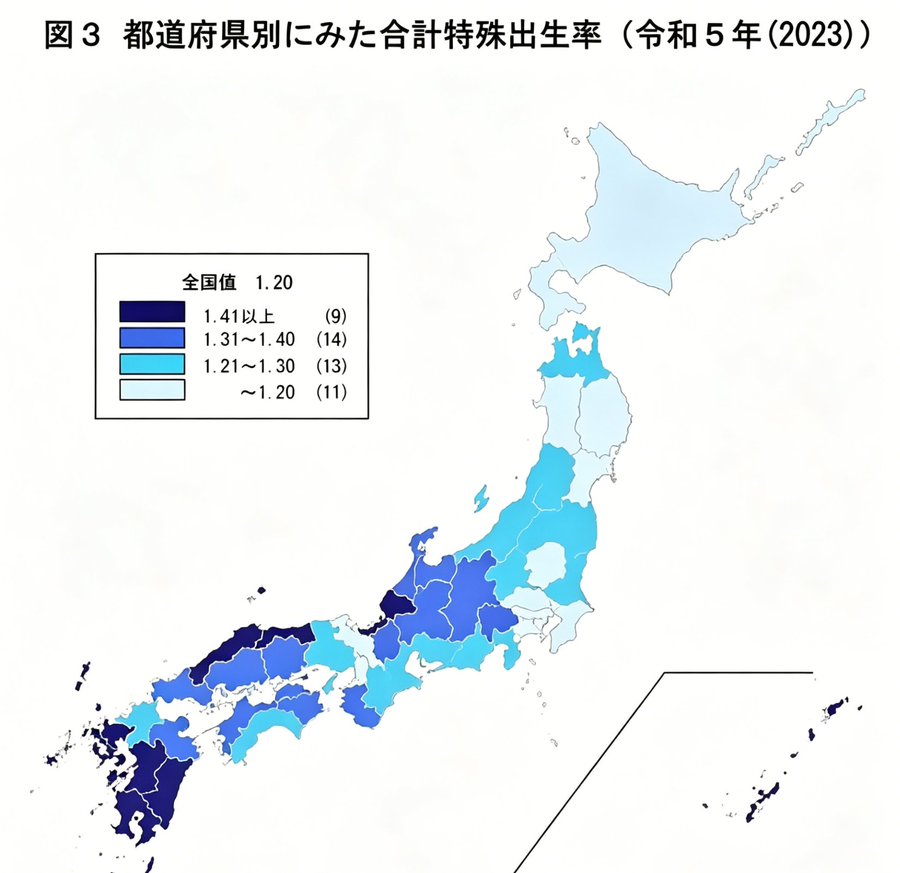
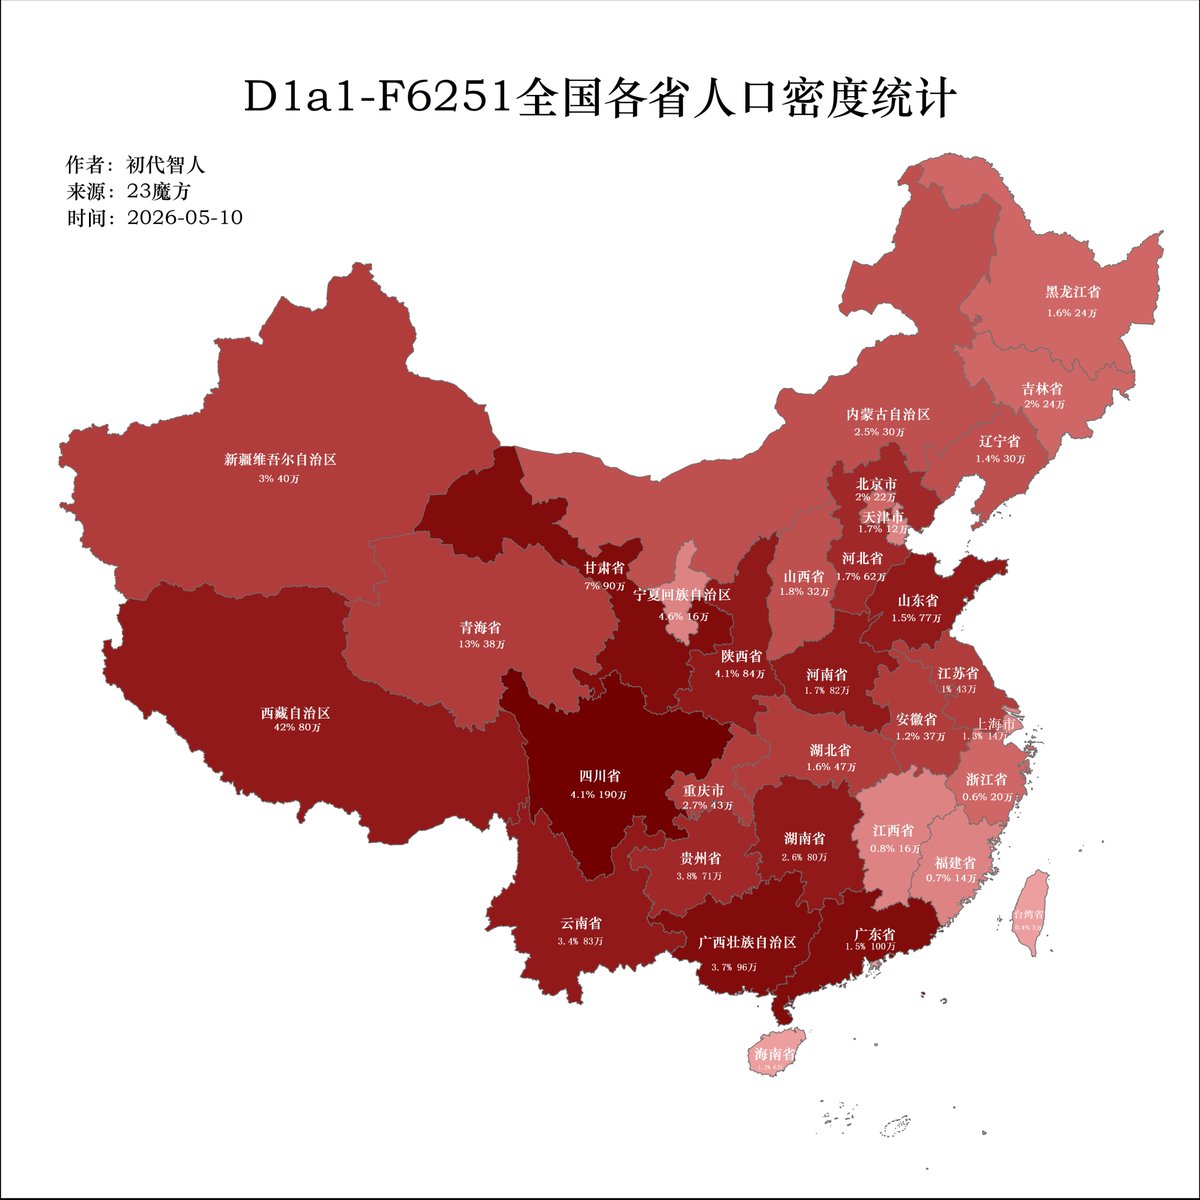
Based on genetic testing data from 23mofang users, we first screened the provincial sample proportion of individuals belonging to Y-haplogroup D. Combined with the male resident population of each province, we calculated the population density distribution of Y-haplogroup D across China’s provinces.
The results show that the provinces with the largest population of Y-haplogroup D are mainly Sichuan, Guangdong, Guangxi, Gansu and Shaanxi, which is consistent with prior expectations. After excluding the impact of the large inherent population base of Guangdong and Guangxi, the overall distribution presents a gradual declining gradient from Northwest and Western China toward the southeast coast and eastern regions. The estimated national average proportion of Y-haplogroup D is approximately 2.5%.
It should be noted that the data may contain errors in users’ self-reported native provinces, as well as disparities in genetic testing willingness across regions. The sample does not constitute a strictly randomized survey, and the statistical results are for reference only.
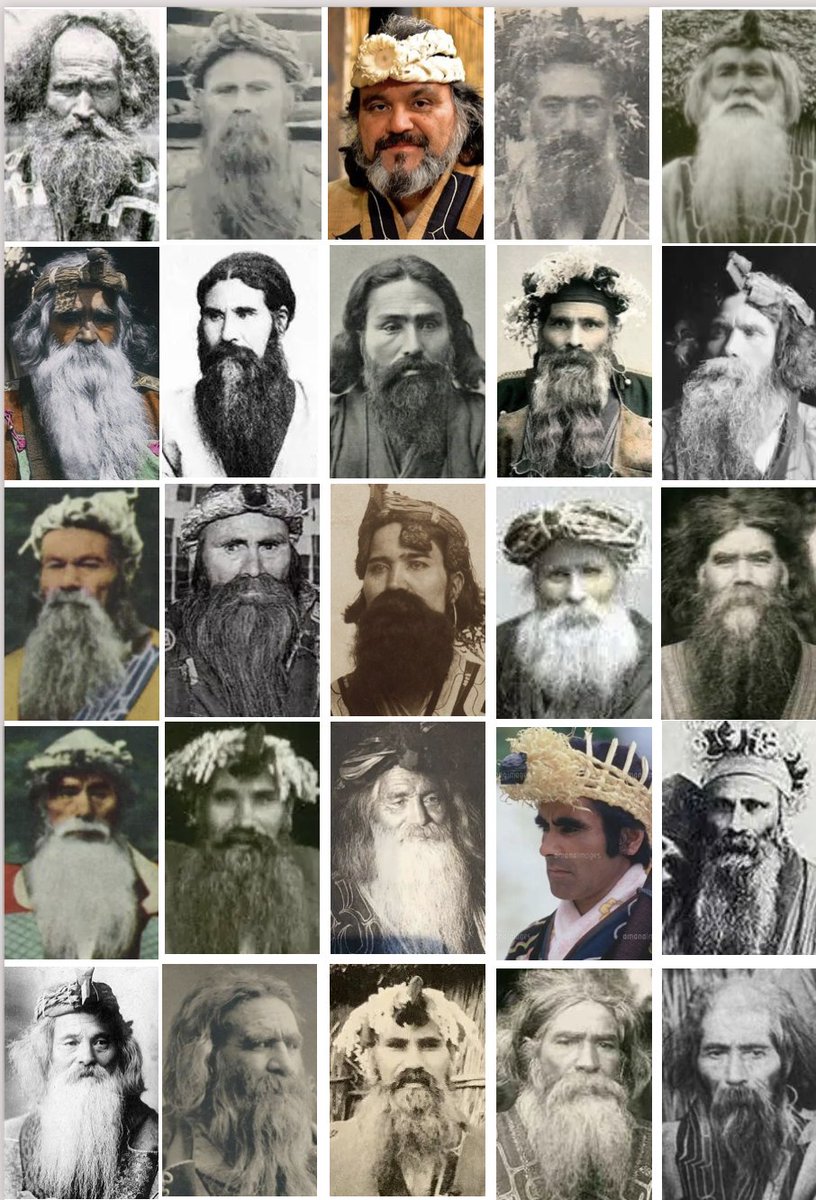
The most distinctive physical trait of the Ainu people is excessive body hair. Adult men can typically grow chest-length beards, bearing facial features reminiscent of Mediterranean populations.
Marked facial dimorphism between males and females is also observable, a result of partial genetic influence from the Nivkh people. Crossbreeding became increasingly common after the late 19th century; such mixed individuals combine flat facial structure with exceptionally thick beards.
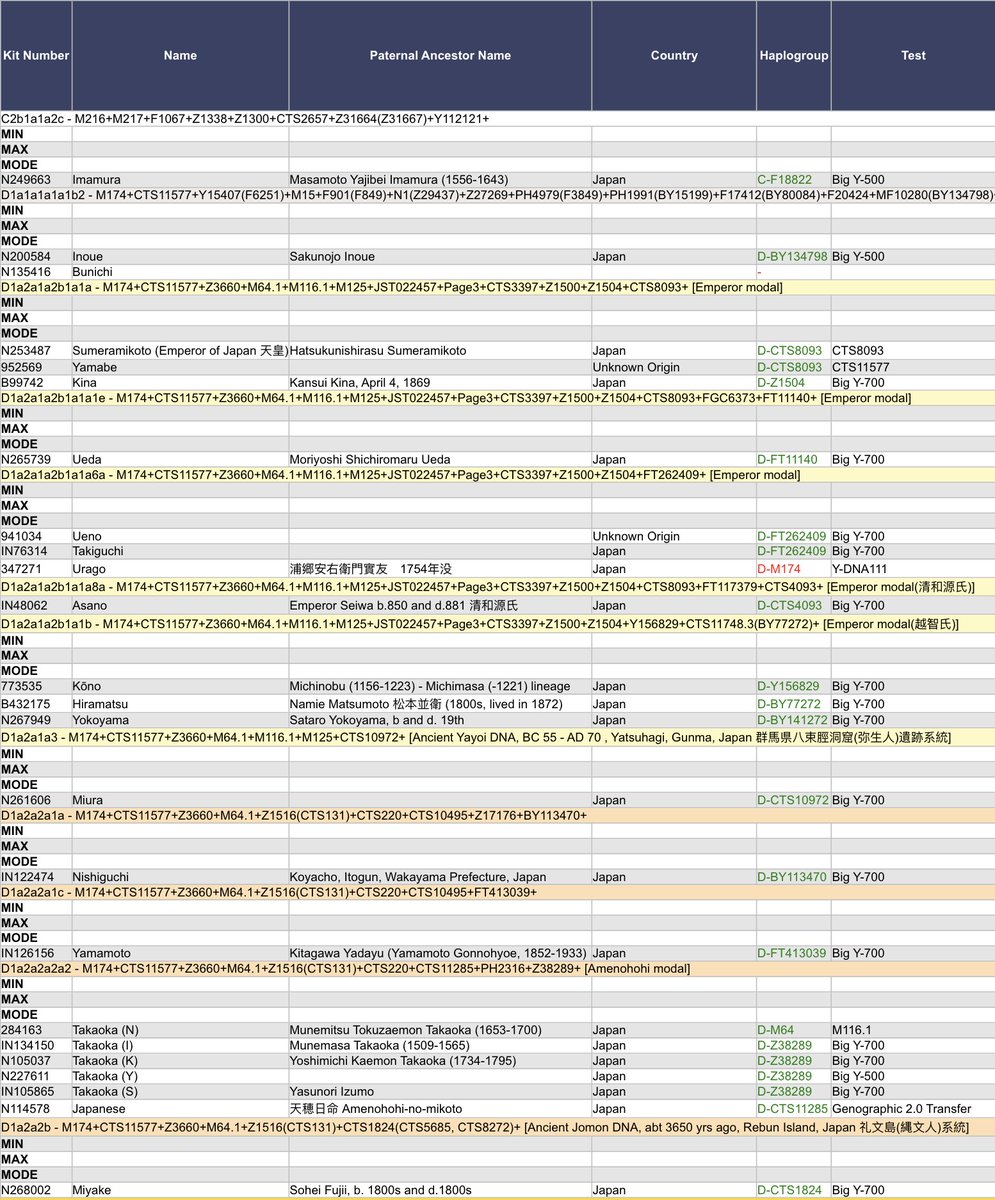
Regarding the Samurai DNA Project by FTDNA, green indicates confirmation through SNP testing, while red indicates haplogroup prediction based on inference. The project includes many Japanese imperial relatives and aristocratic samurai. Notably, the descendants of the Japanese Emperor in this project belong to D‑CTS8093, a downstream subclade of D‑Z1500.
The image only captures the first half of the project data.
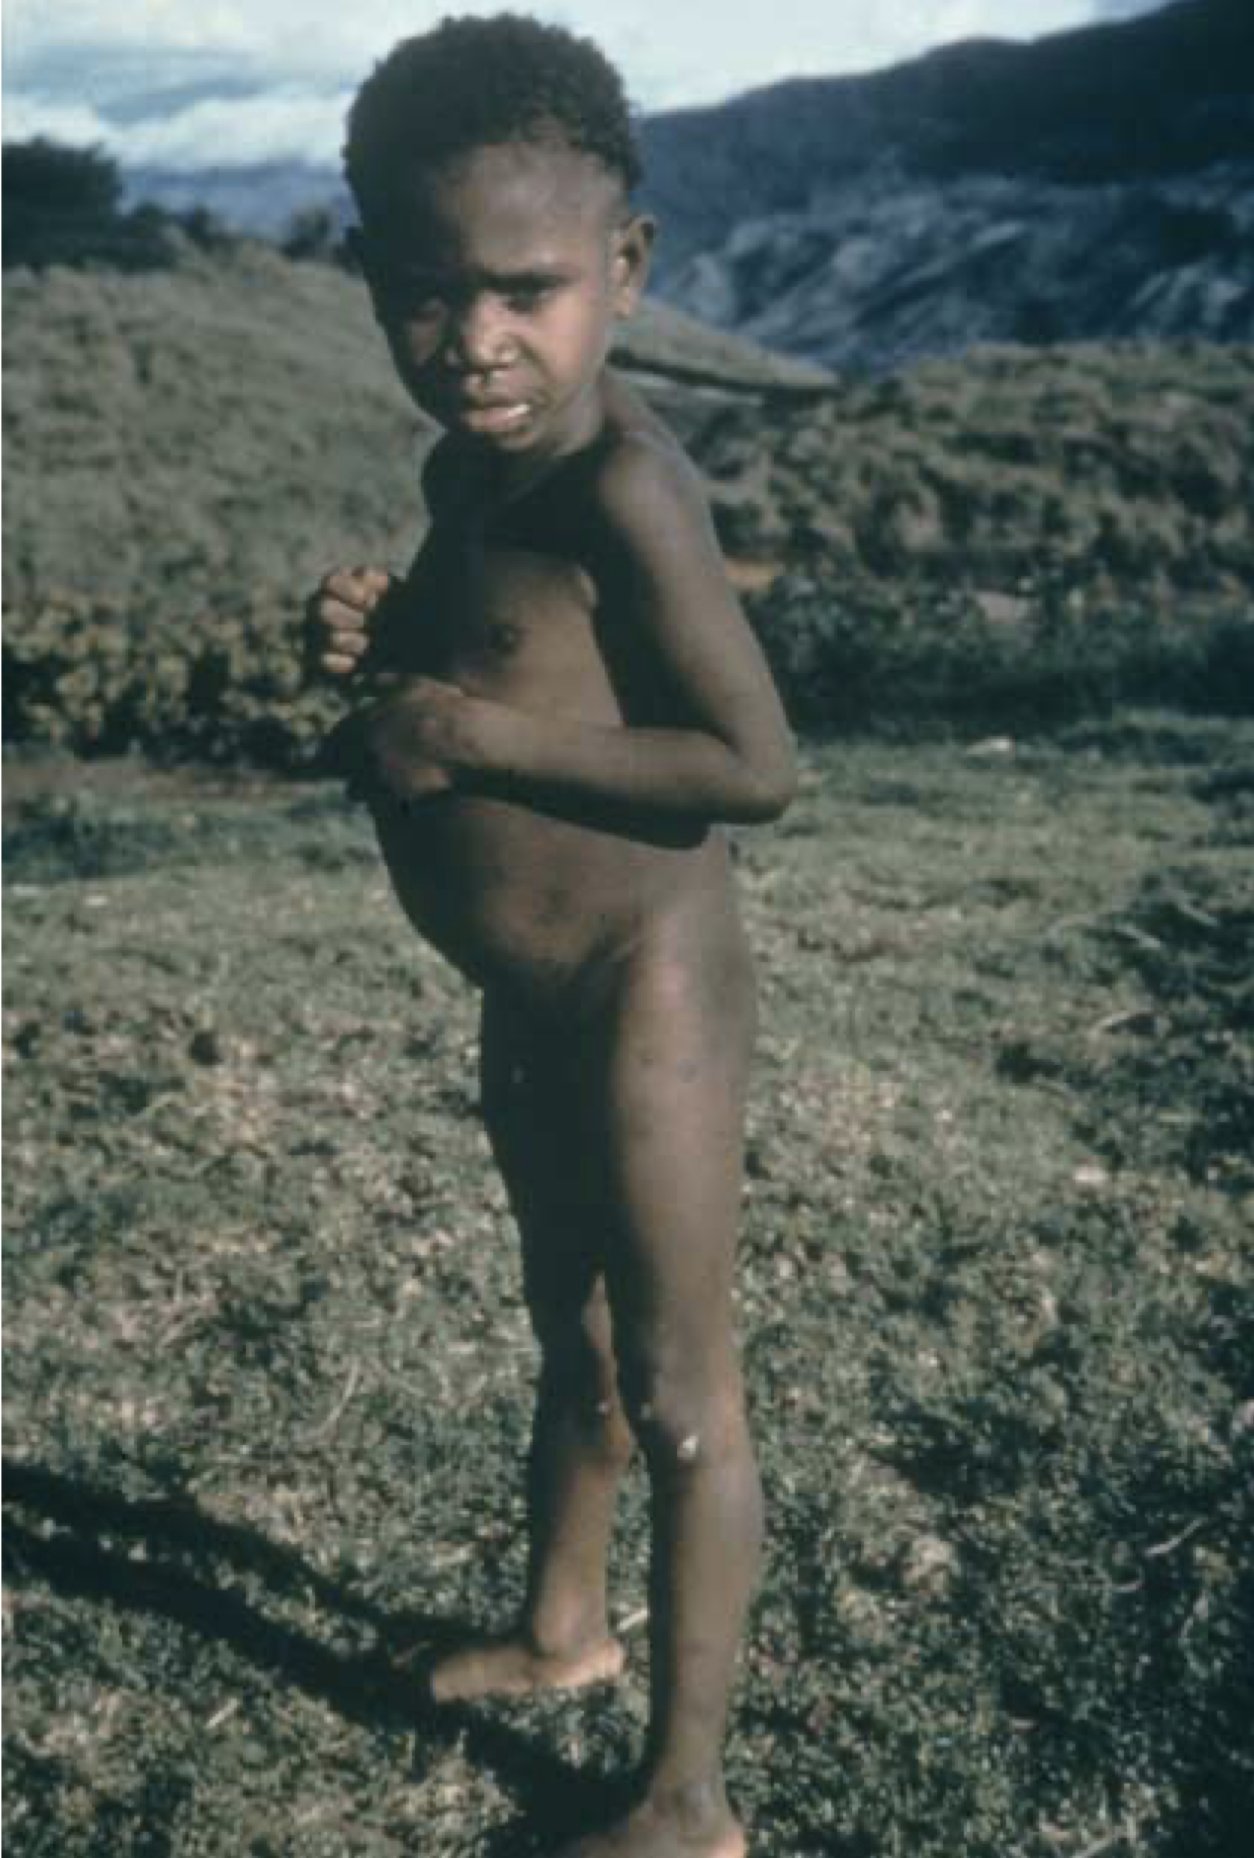
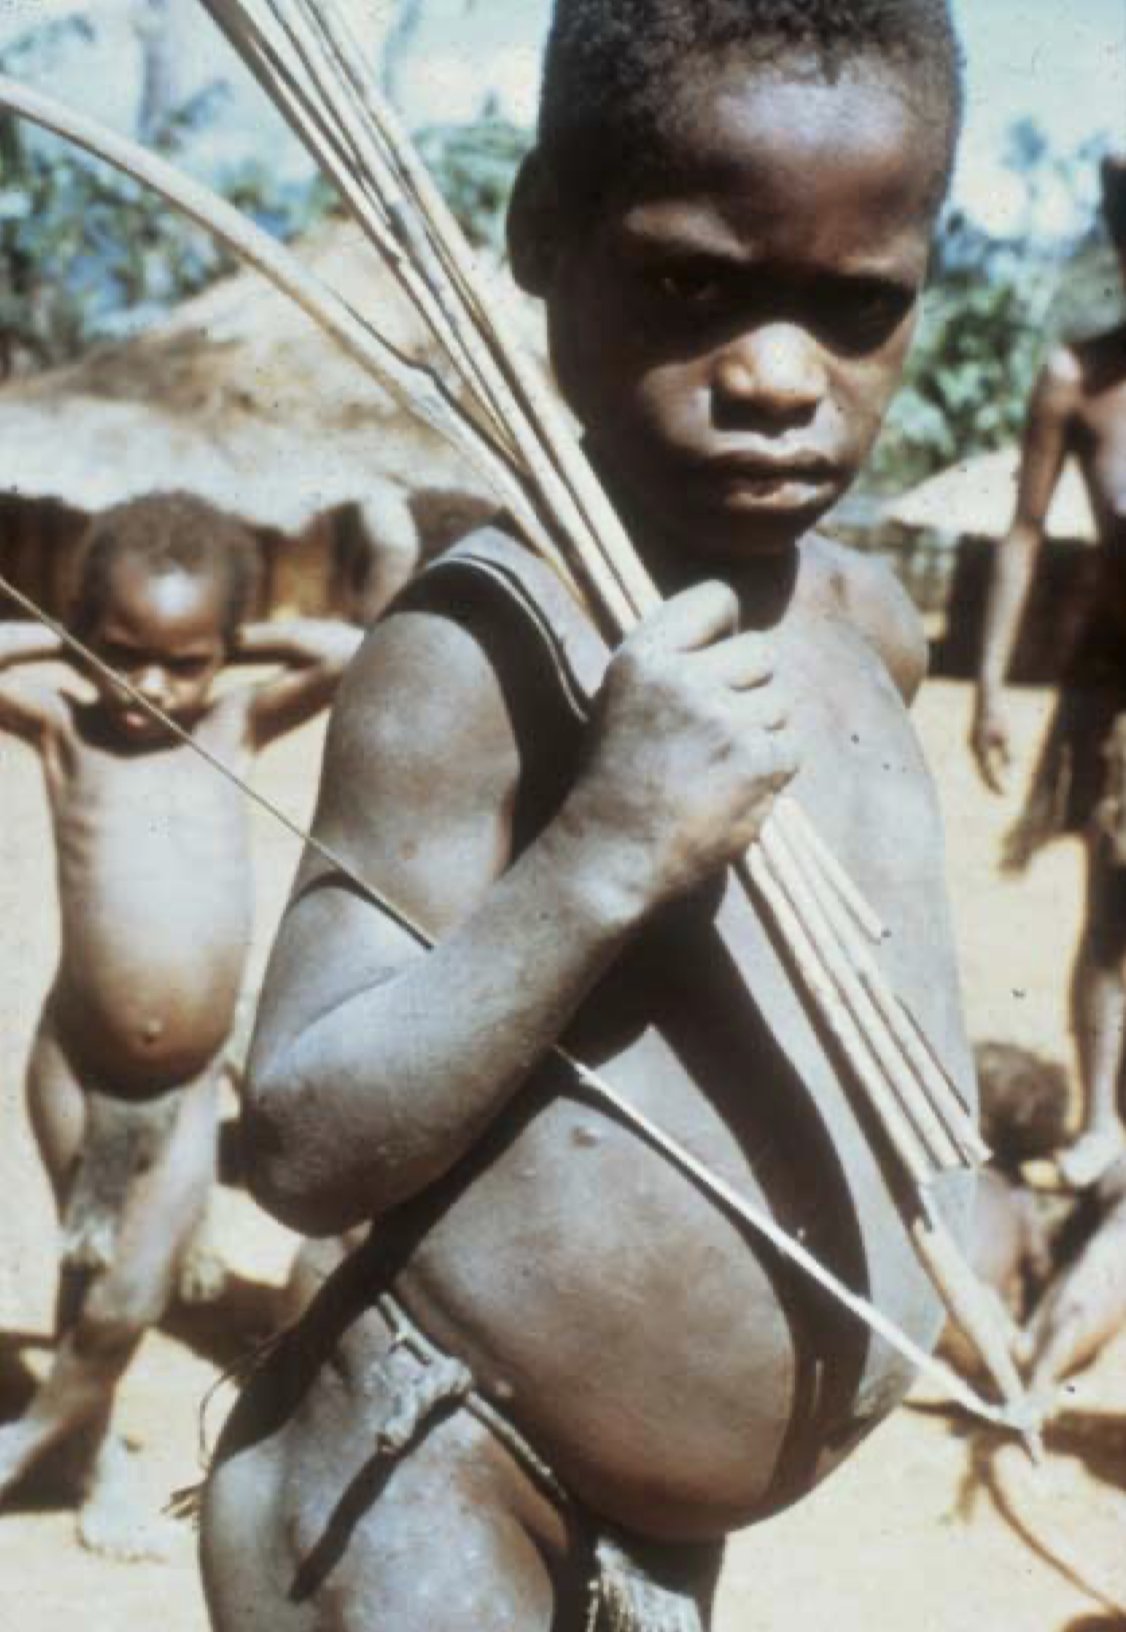
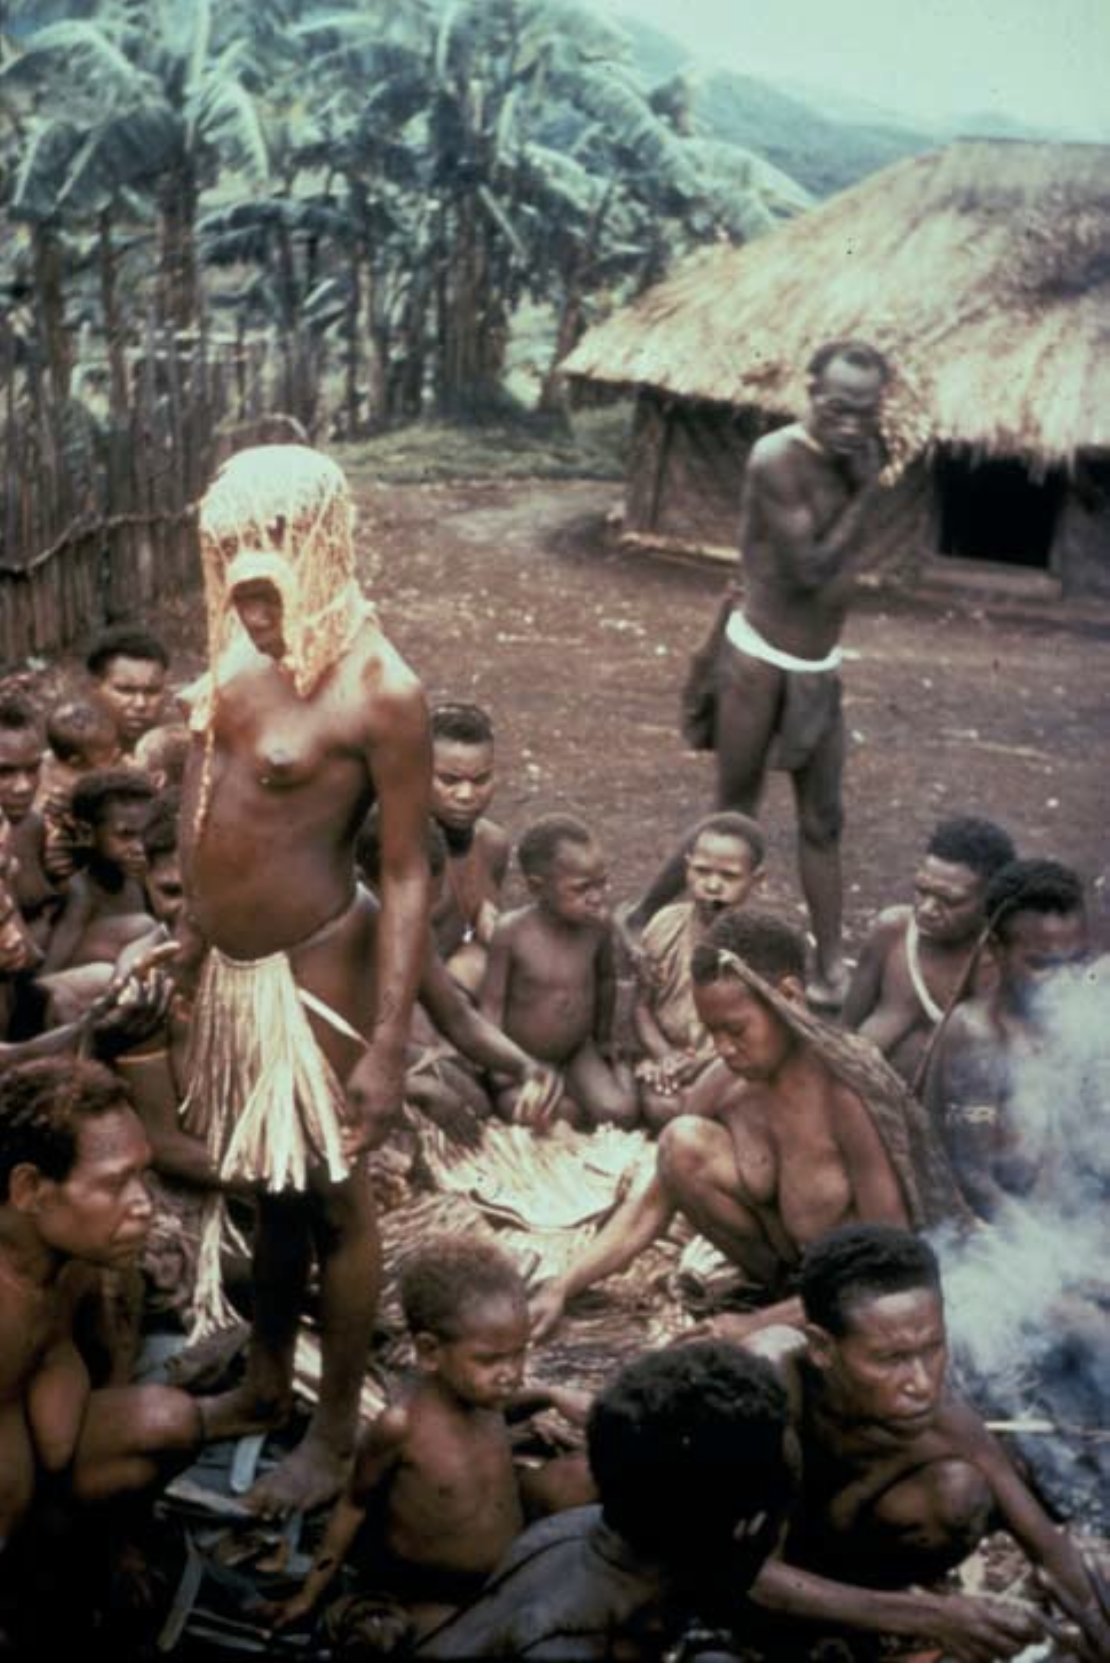
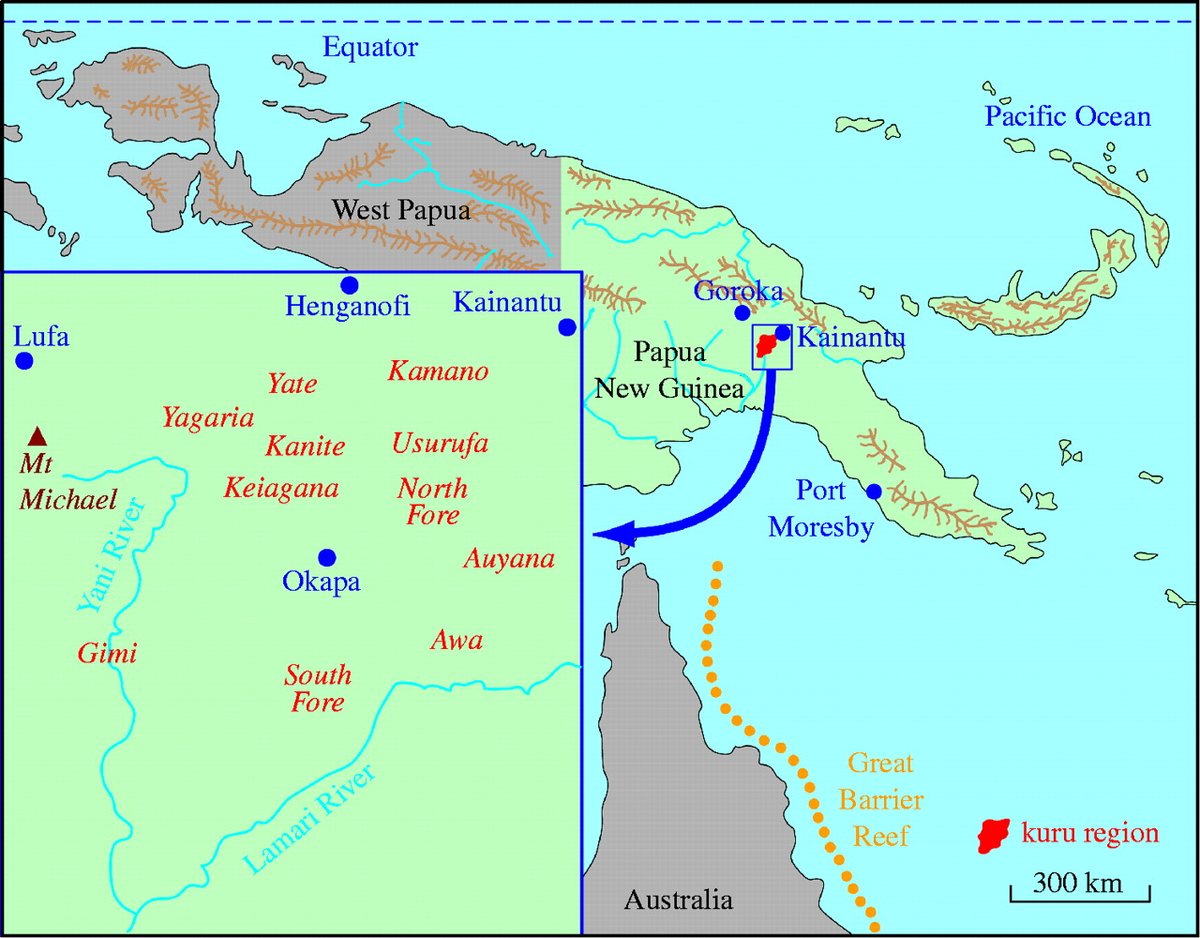
The Fore people reside in the Okapa District of the Eastern Highlands Province, Papua New Guinea, with a population of approximately 20,000. Between the 1950s and 1970s, Kuru disease was discovered among the Fore tribe, and it was suspected to be related to the local cannibalistic customs. To date, no genetic studies on the paternal and maternal lineages of the Fore people have been conducted, but their genetic structure is presumably similar to that of the Papuans.
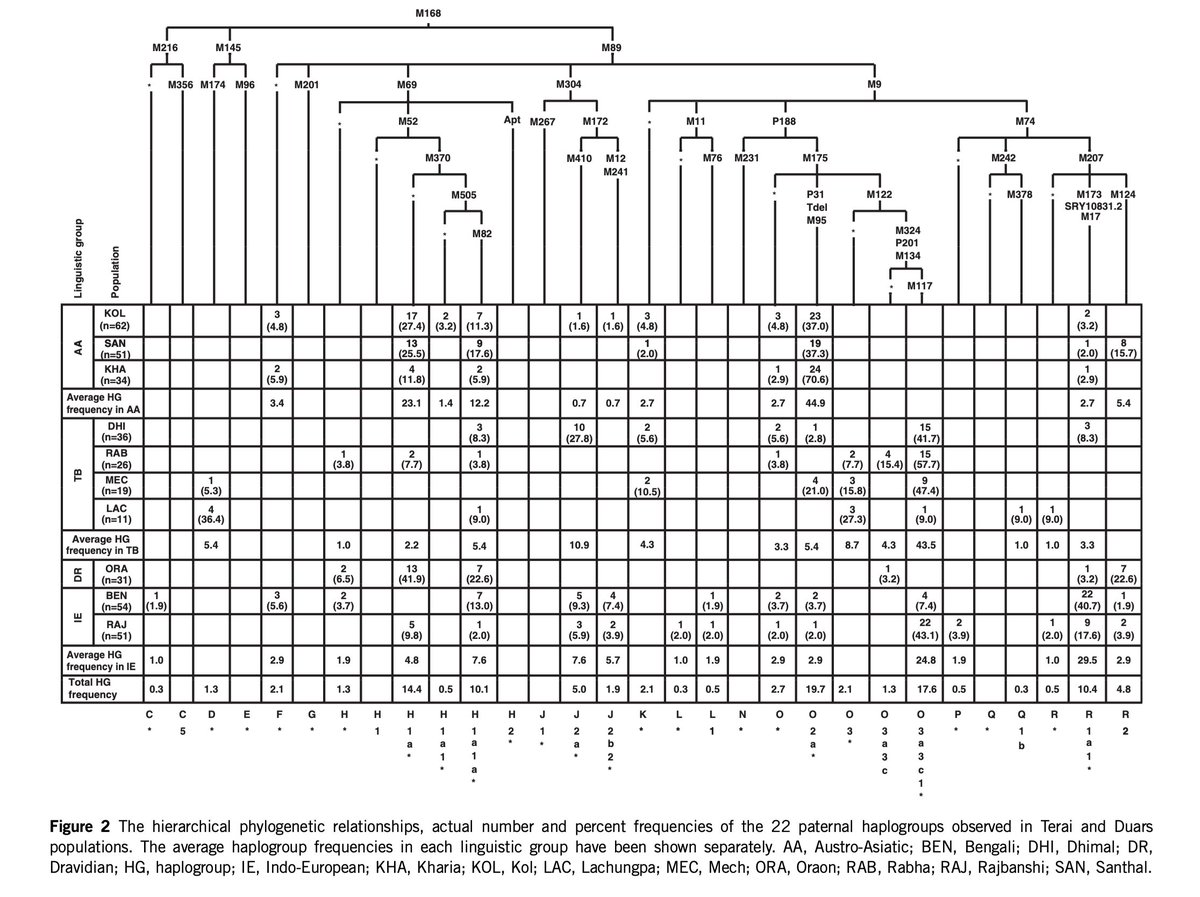
Regarding the research on paternal haplogroups in the junction area between Northeast India and the Himalayas, its main value lies in providing data on the paternal lineage proportions of the Sikkimese people (Lachungpa/LAC). Among these lineages, D1a1 is the most frequent, accounting for 36.4%. Although no subtyping was conducted at that time, it should be a downstream branch of D1a1-P47, similar to that of Tibetans. This is also one of the few studies that have conducted paternal lineage statistics on the Sikkimese people.
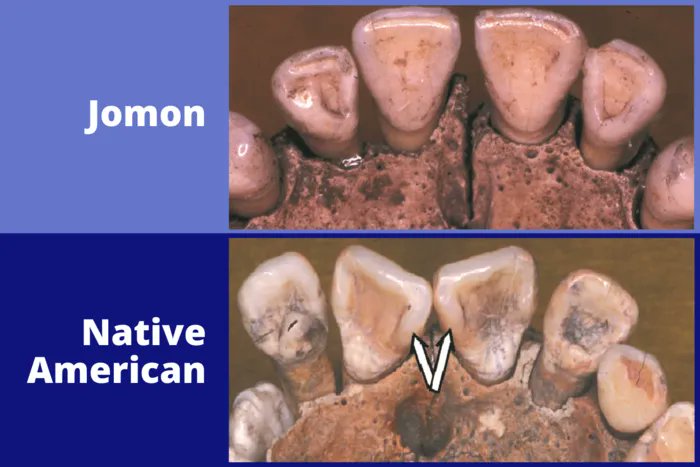
If we compare the teeth of the Jomon people and Native Americans, we find that Native Americans have a distinct shovel-shaped structure in their incisors, but the Jomon people’s teeth do not. Shovel-shaped incisors were initially thought to be related to Homo erectus, and many unearthed Homo erectus fossils show shovel-shaped teeth. This suggests that the Jomon people, at least, did not play a significant role in the interbreeding of early humans with other ancient humans, and the same is likely true for other related branches.
The EDAR 370A mutation, characteristic of East Asia and the Americas, is virtually non-existent in the Jomon population. This dental feature aligns with recent molecular anthropological studies. According to the paper An early East Asian lineage with unexpectedly low Denisovan ancestry, the Jomon people had the lowest Denisovan content compared to other populations in Asia.
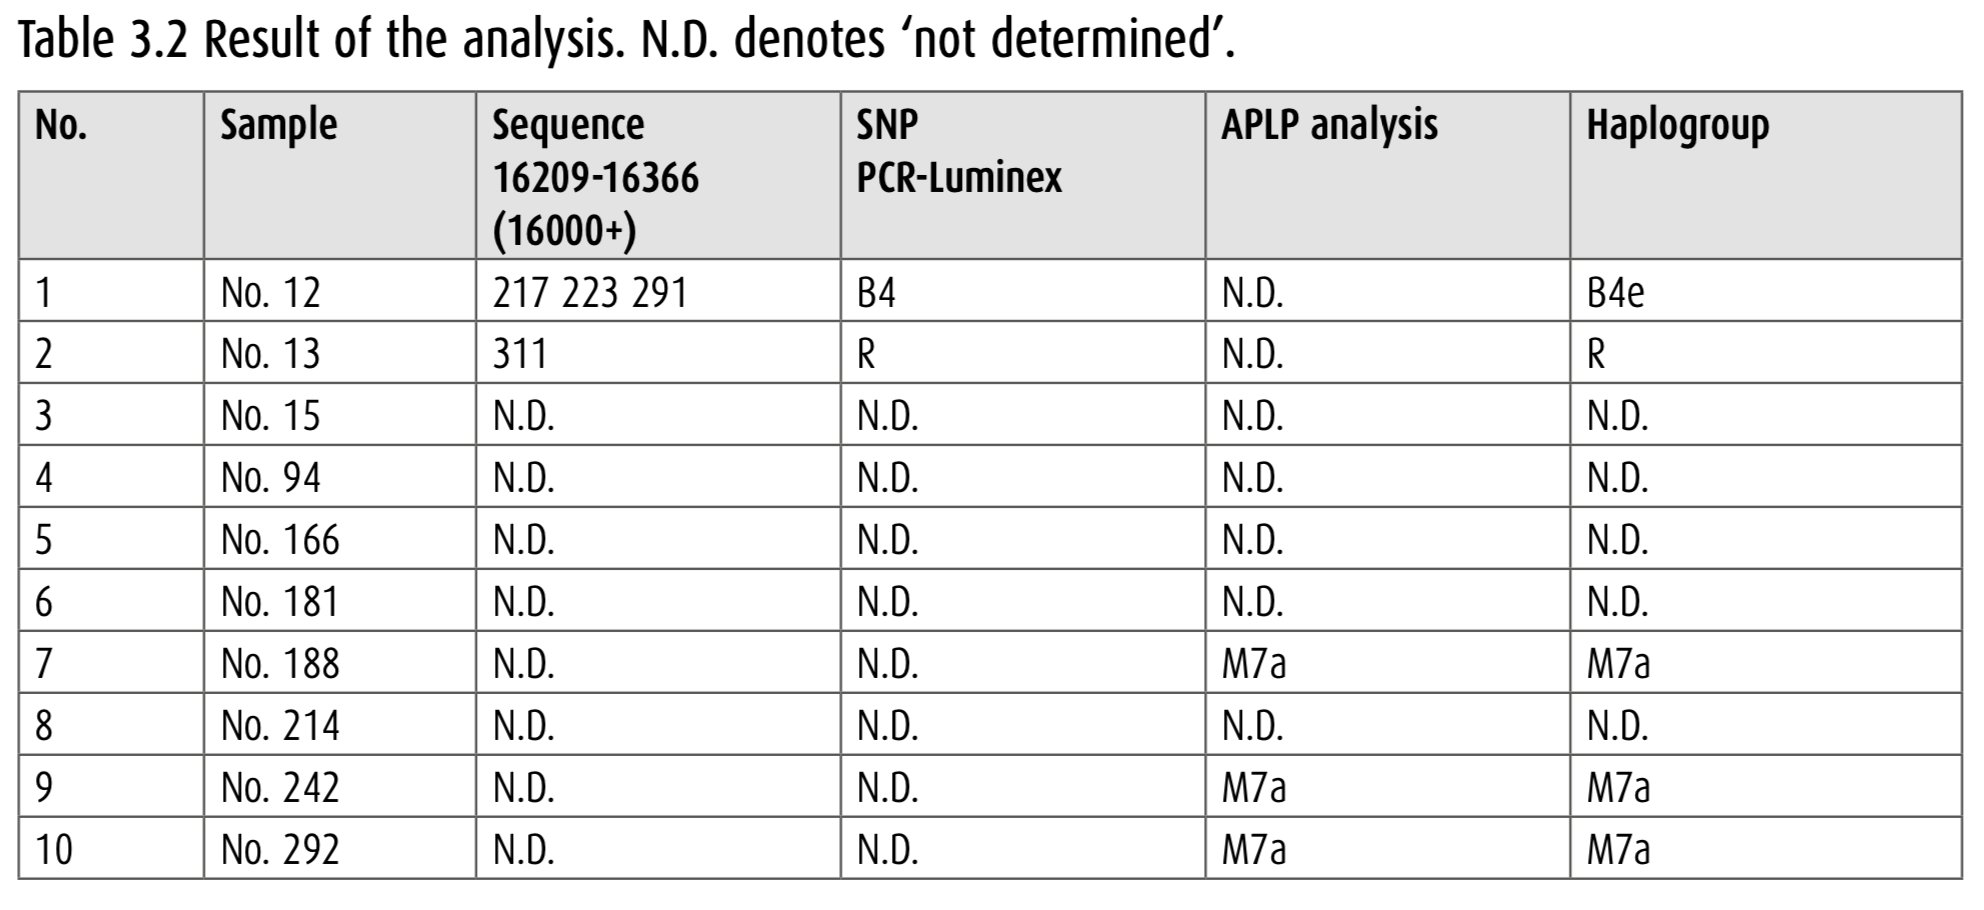
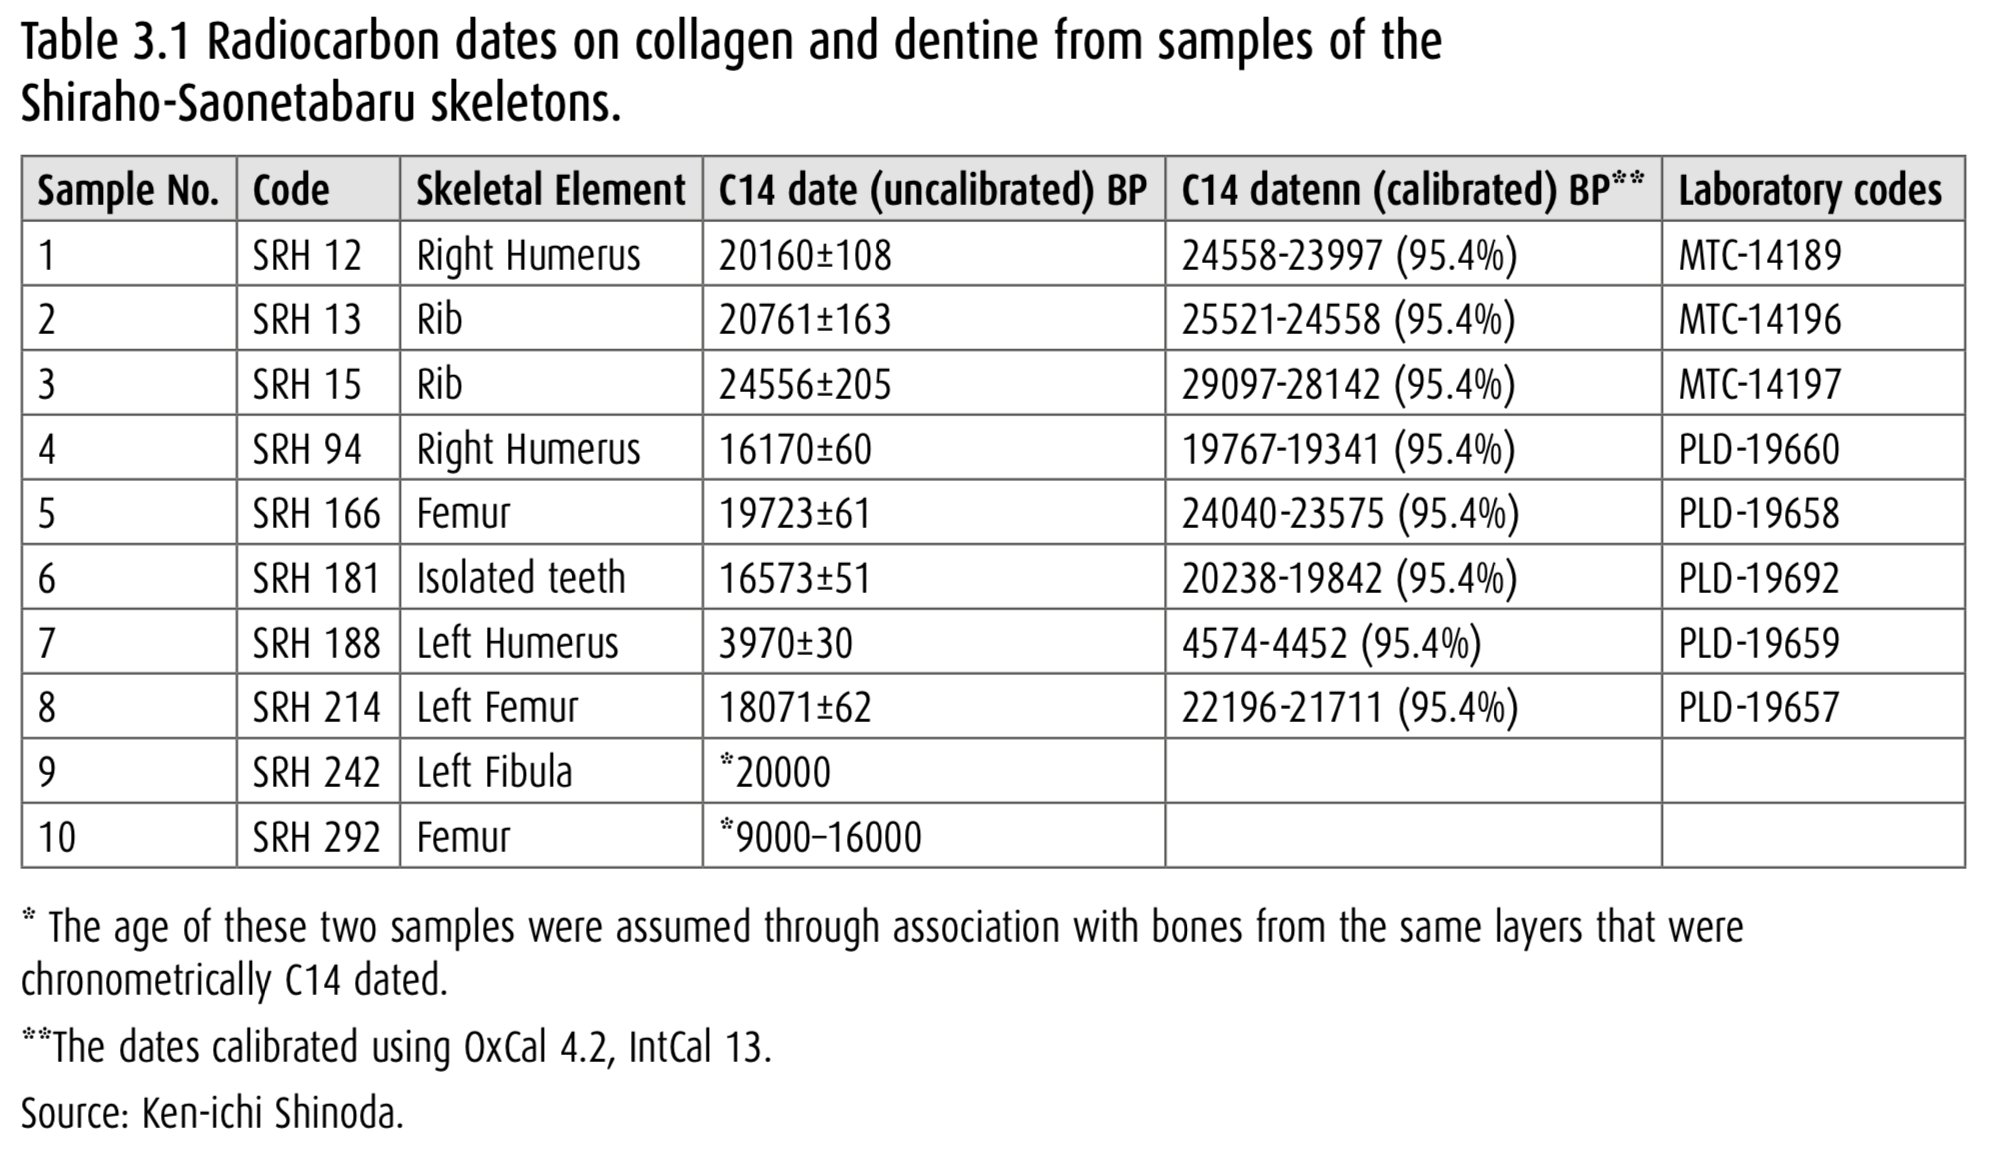
Actually, the most noteworthy ancient Japanese samples should be from the Shiraho–Saonetabaru Cave Site on the eastern coast of Ishigaki Island, Okinawa. Among them, two maternal lineages are B4e and one undifferentiated R*, with a dating of over 20,000 years. Compared with other ancient Japanese samples, these possess significant research value. Based on the site’s location and age, it is highly probable that the paternal lineage of the Shiraho people includes D1a2-M55.
Previous studies on the M7a maternal lineage among the Shiraho people have already clearly shown that it was long associated with the Jōmon people and is one of the two fundamental maternal lineages of the Jōmon, alongside N9b and M7a. However, B4e and R* have been rarely unearthed—B4e accounts for only 0.5% of the current Okinawan population. What I am actually more concerned about is the origin of this R* lineage, and I aim to further subdivide it in future research.
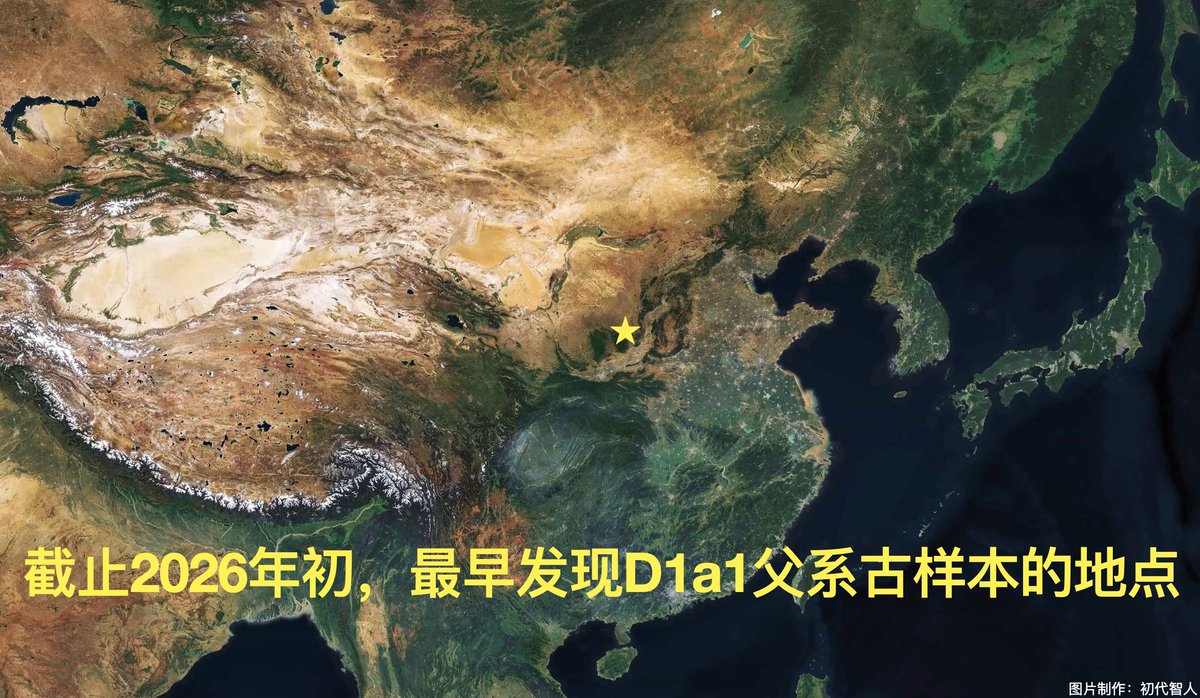
As of the beginning of 2026, there are only two officially published ancient DNA samples that represent the earliest theoretical upper limit of the D1a1-F6251 lineage, both dating back approximately 6,000 years. One sample comes from the Wangjiayinwa Site in Qin’an County, Tianshui City, Gansu Province, dated to 5750±200 years ago, with the paternal haplogroup D‑F17412 and maternal haplogroup A25. The other sample is from the Gedachuan Site in Zhangjiachuan Hui Autonomous County, Tianshui City, Gansu Province, dated to 5706±55 years ago, carrying the paternal haplogroup D‑F17412 and maternal haplogroup D4b2b.
Notably, the Wangjiayinwa Site is approximately 4–8 kilometers away from the Dadiwan Site, while the Gedachuan Site lies about 15 kilometers to the west of Dadiwan. All three sites are located in the upper reaches of the Weihe River basin in eastern Gansu. Since the broadcast of the documentary In Search of East Asia’s Most Ancient Tribe, which focuses on the Baima people, a claim has persisted that the Dadiwan Culture had a 100% D1a1 paternal lineage. Current evidence appears to support this claim to some extent. However, it is unlikely that official institutions will release D1a1 sample data from the Dadiwan Site in the near future, given that Dadiwan is recognized as one of the important origins of the Yangshao Culture. In contrast, publishing data from sites surrounding Dadiwan seems to face fewer obstacles.
In the early days, Li Hui’s research may have overstated conclusions due to limited sample sizes, once asserting that the Baima people had a 100% D1a1 paternal lineage. Recent genetic testing, however, shows this proportion to be around 60%, roughly on par with that of the Tibetan ethnic group. It is reasonable to infer that the D1a1 paternal lineage proportion in the Dadiwan Culture and its surrounding sites falls within the range of 40–60%, indicating that the population had already undergone genetic admixture with other groups.
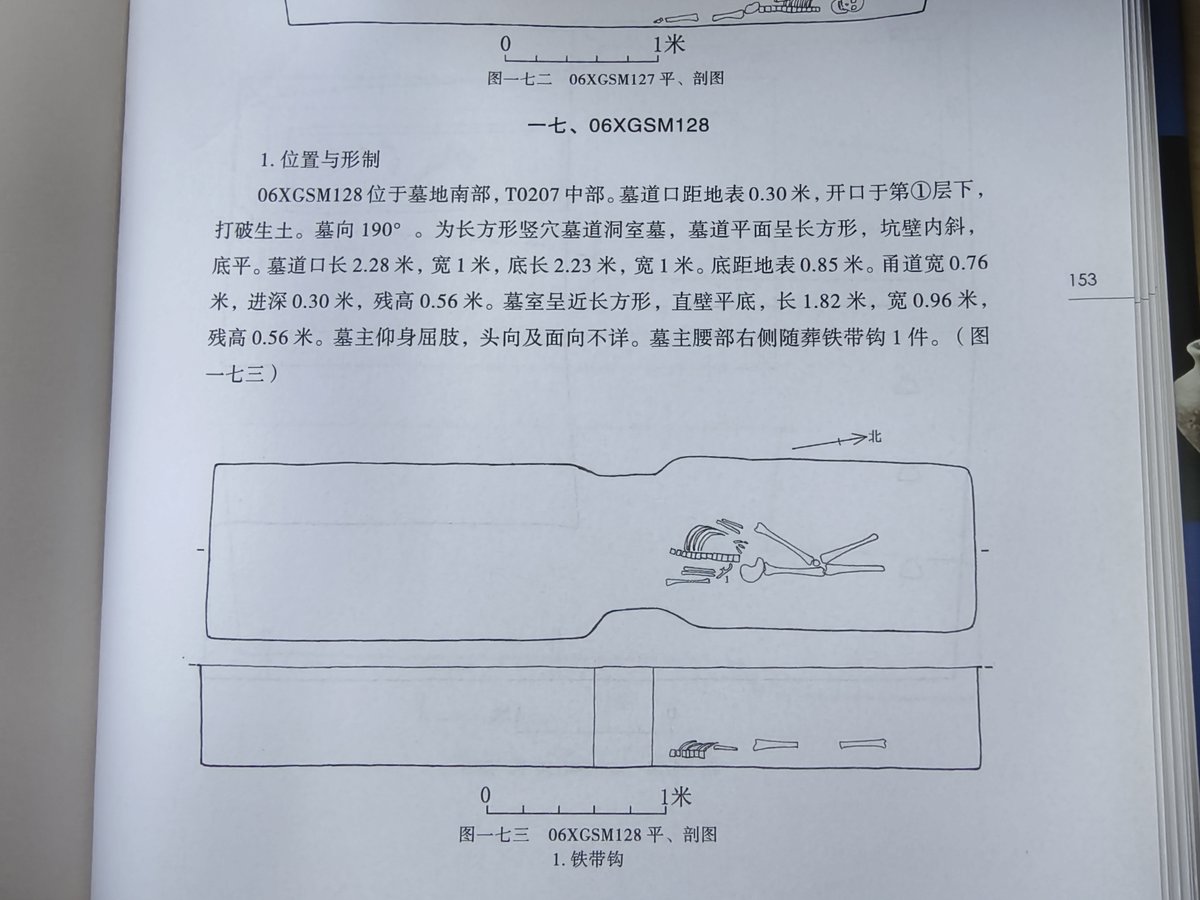
The tomb occupant, designated by the sample code XSM-M128-1, was unearthed from the Warring States Period Xisima Site in Simakou Village, Gaocun Township, Xingyang City, Henan Province.
Genetically, the individual belongs to the paternal haplogroup D‑FT241207, a downstream lineage of D‑Z31591, and the maternal haplogroup F2i. According to the archaeological excavation report, the tomb occupant was interred in a supine flexed burial posture—a funerary tradition that occurs at high frequency in the cultures of the Rong ethnic groups.
This makes it highly probable that the individual was a descendant of the Rong-Qiang peoples who migrated eastward from Northwest China to the Central Plains during the Warring States Period. Nevertheless, the tomb’s structure and burial goods were entirely acculturated to Central Plains traditions, indicating that the individual had become fully integrated into the local population.
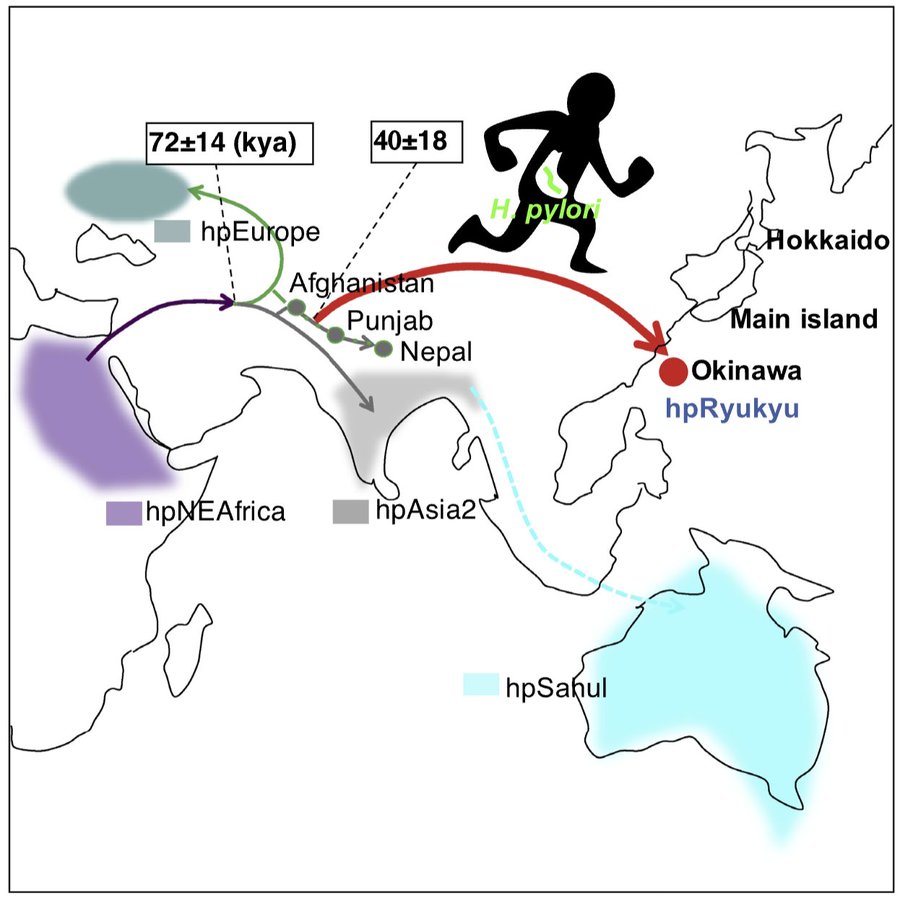
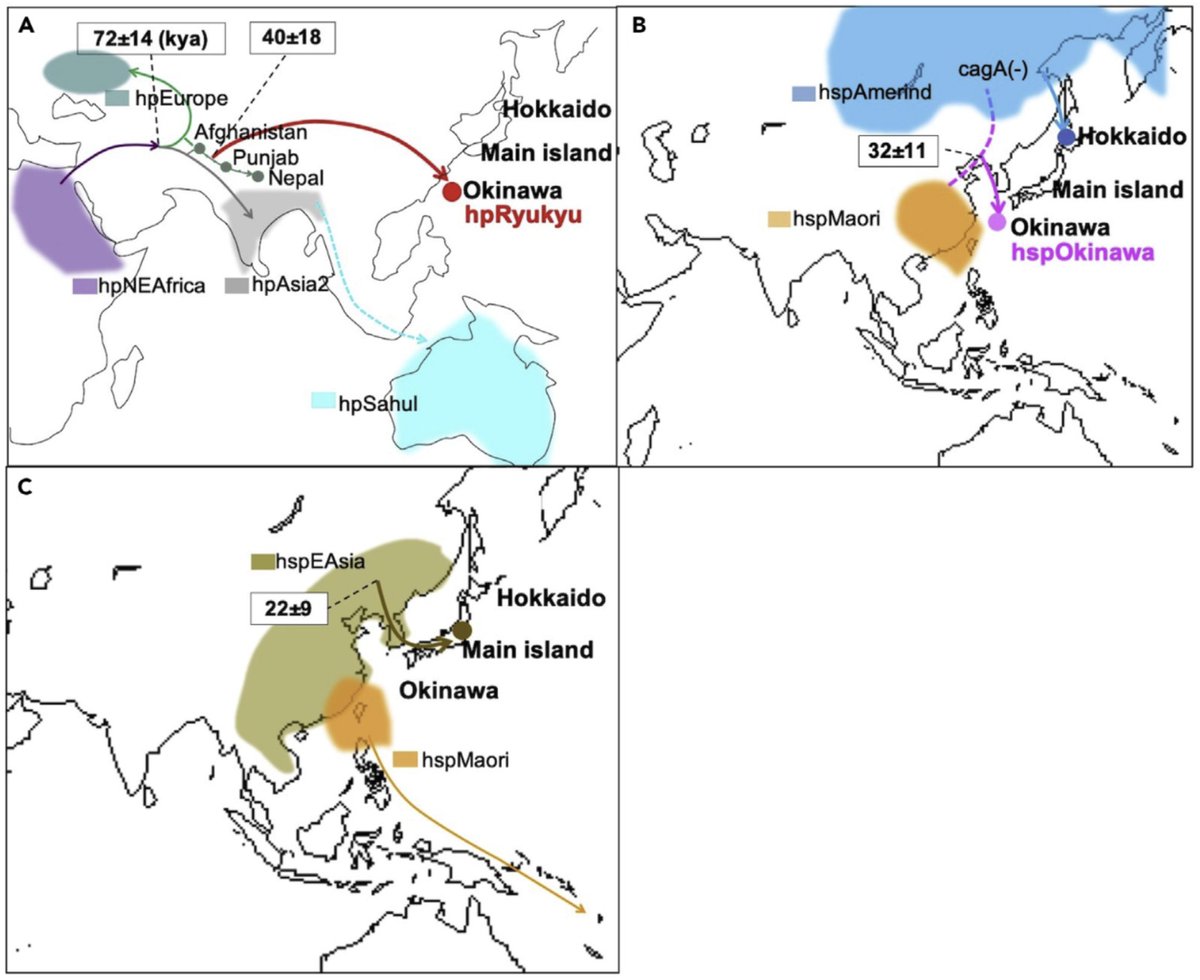
This study identified a Helicobacter pylori strain endemic to Okinawa, Japan, which is absent in mainland Japan. Designated as hpRyukyu, this strain accounts for 16% of the current strains in Okinawa and diverged approximately 45,000 years ago. Its closest related strains were found in Afghanistan, Punjab (Pakistan), and Nepal, leading the study to infer that hpRyukyu originated in Central Asia. Through gene flow analysis (f-statistics), the possibility that the human populations carrying this strain migrated to Okinawa, Japan via the southern coastal route was excluded. Instead, it is hypothesized that they migrated to East Asia via the northern route, circumventing the northern foot of the Himalayas.
Paper: Helicobacter pylori genomes reveal Paleolithic human migration to the east end of Asia
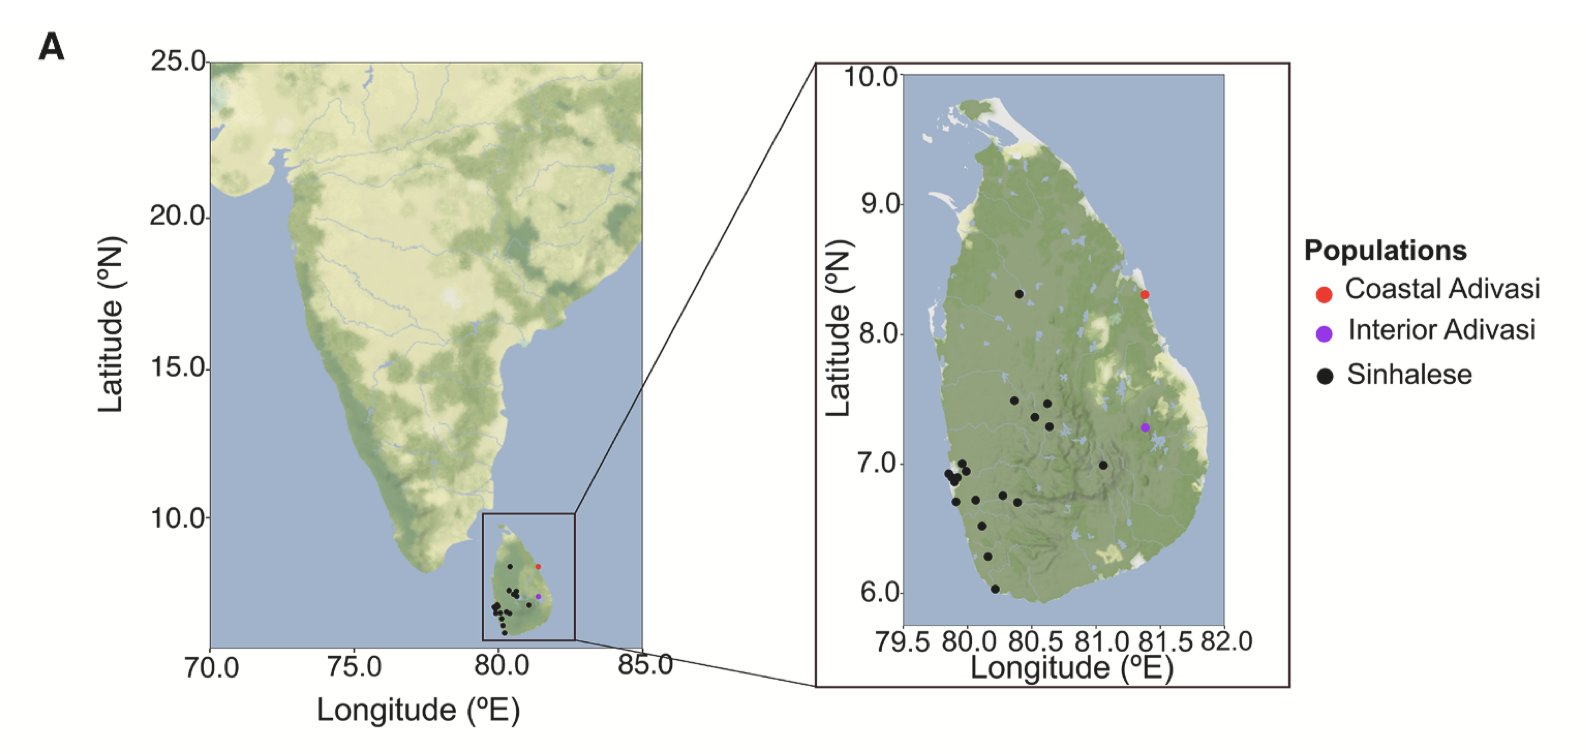
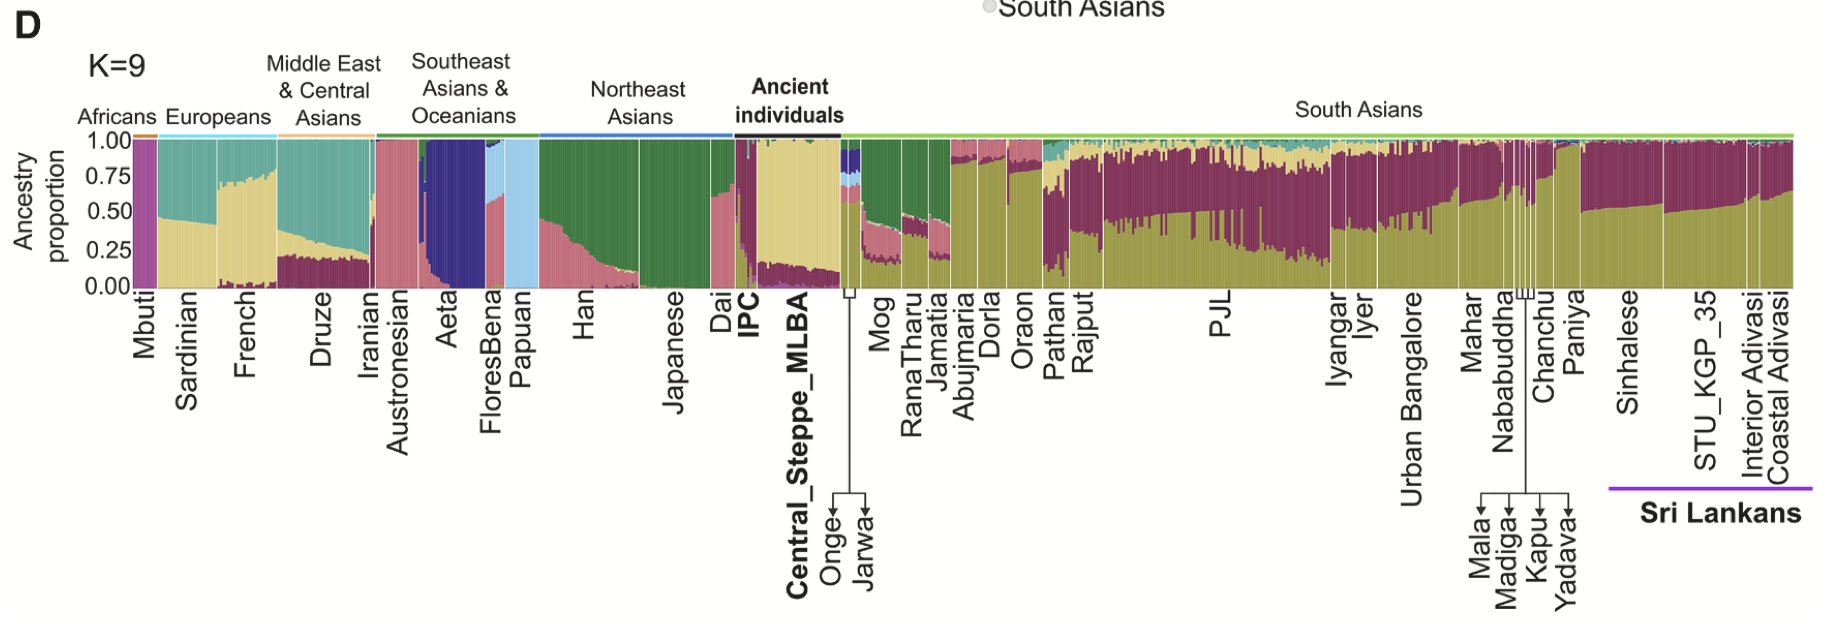
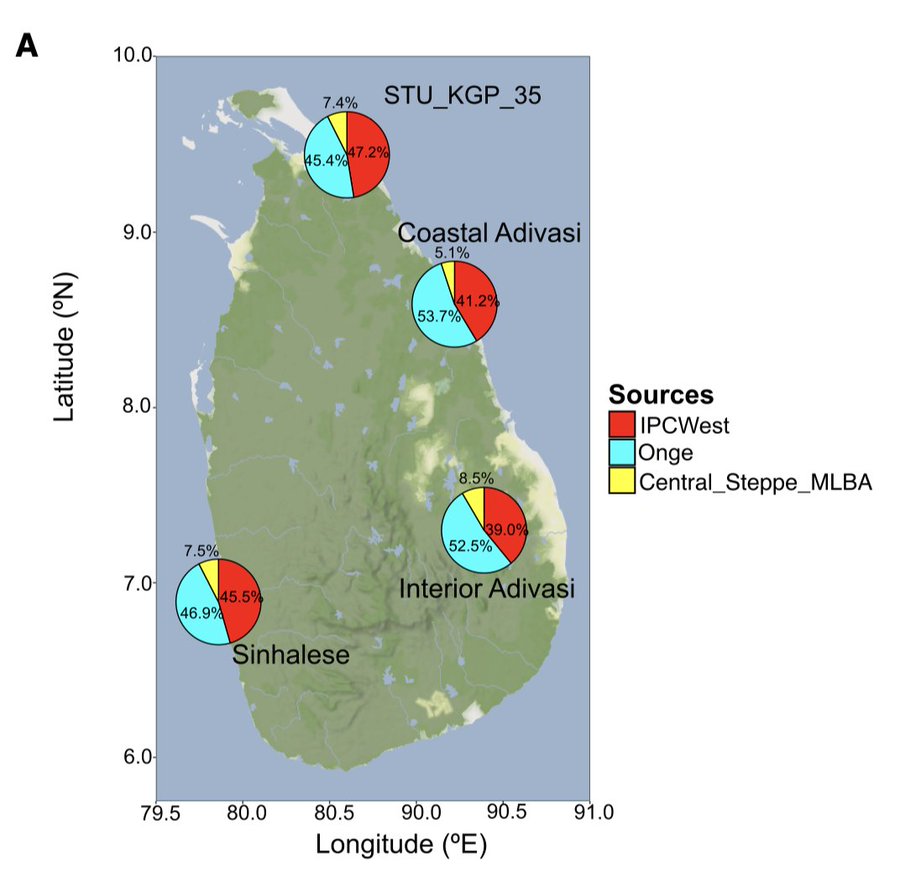
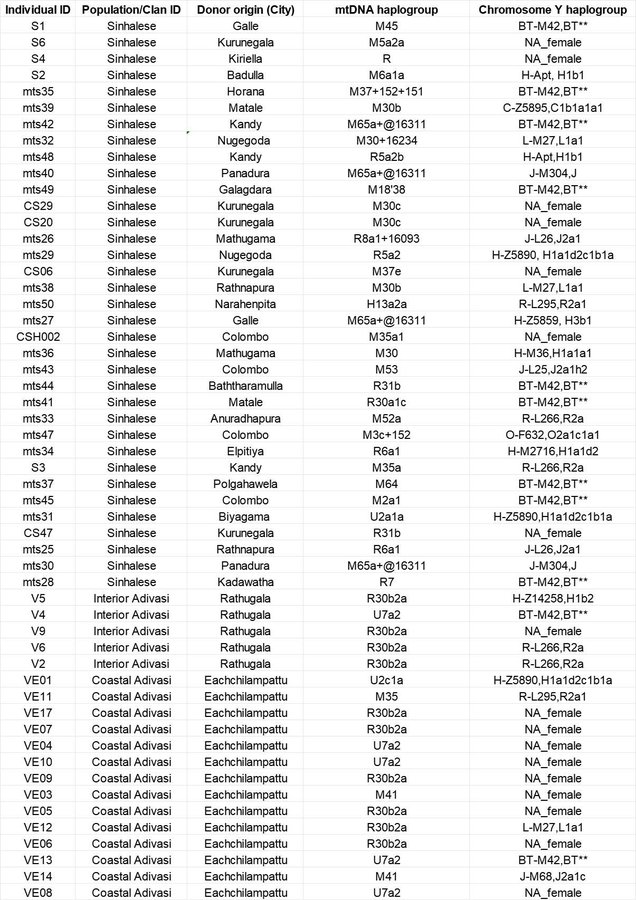
Genetic data related to the Adivasi people, reputed to be the most indigenous inhabitants of Sri Lanka, as well as the Sinhalese people, the major ethnic group of the country, are presented herein. Among the maternal haplogroups of the Adivasi people, R30b2a is relatively frequent. In contrast to the Adivasi people’s maternal haplogroups of M41 and M35, the Sinhalese people exhibit significantly greater diversity in their M maternal haplogroups, which include M45, M5a2a, M6a1a, M30b, M37*, M65a, M30, M18’38, M30c, M37e, M30b, M65a, M35a1, M64, M65a, M2a1, M3c, M52a and M53. However, the R maternal haplogroups of the Adivasi people also suffer from insufficient diversity in downstream subclades; except for U2c1a, all the remaining U maternal haplogroups belong to U7a2.
The paternal haplogroups of both populations are dominated by BT‑M42 (based on previous South Asian genetic data, this can be identified as the unclassified F‑M89, i.e., F*), along with H, L and R2a. Additionally, each population has one sample of C‑Z5895 and O‑F632 respectively (the presence of O‑F632 here is perplexing, indicating that the formation of the Sinhalese people might have occurred relatively late). This paternal genetic structure is characteristic of the marginal tribal groups in South Asia, featuring F as the dominant haplogroup plus a small proportion of C haplogroups. Notably, the Sinhalese people have been influenced by more Near Eastern ancestry. Consequently, the Adivasi people have a slightly higher proportion of AASI ancestry than the Sinhalese people, though the difference is not substantial.
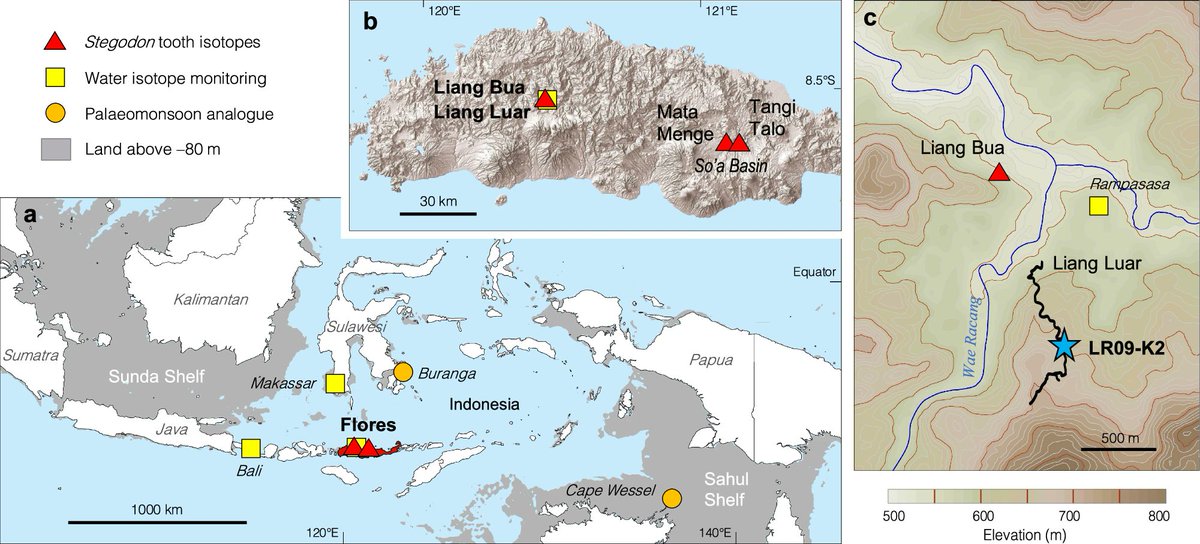
This paper infers a decline (i.e., extinction) of the Homo floresiensis population by conducting geochemical analyses of stalagmites from caves in the Liang Bua area of Flores Island, linking this decline to a period of climatic aridification.
Setting aside ongoing debates over the chronology of the Homo floresiensis, my concern lies with the implicit assumption that the dating of a single hominin fossil necessarily marks the turning point toward the extinction of the entire population. The so-called Homo floresiensis may not have gone extinct at the time represented by the excavated specimen; rather, they may have persisted for a substantial period afterward—possibly much later than commonly assumed—and may even have participated in admixture with Homo sapiens.
These considerations are based on the assumption that the Homo floresiensis constituted a distinct species. However, following the view of Maciej Henneberg, it is also possible that the Flores hominins represent pathological Homo sapiens rather than a separate species.