Preface
Fundamental Worldview Framework and Research Route
Before formally commencing this work, three foundational frameworks need to be established. If readers hold presuppositions conflicting with mine, the value delivered by this hypothesis will be considerably limited. The first framework concerns the fundamentals of human migration. Advocates of an out‑of‑Africa‑origin‑alternative hypothesis for anatomically modern humans have failed to provide a plausible explanation for the fact that all non‑MN sister branches of the L3 maternal lineage are distributed across Africa, as well as the observation that the B paternal lineage, a sibling clade of CT‑M168, is also confined to Africa. Until an evidentiary chain demonstrating that anatomically modern humans originated outside Africa, migrated into Africa, and subsequently returned to Eurasia can be established, I remain inclined to trace the direct ancestral roots of anatomically modern humans back to some region within Africa.
Nevertheless, I hold several objections to the traditional Out of Africa theory. First, I reject the proposition that the critical formative phase of “fully‑fledged Late Homo sapiens” took place within Africa, a point that will be briefly elaborated in the main text. Second, I disagree with the oversimplified narrative that, after modern humans departed Africa, scattered archaic hominin populations across the globe simply “disappeared upon arrival”. This narrative assumes that local archaic humans vanished automatically and without further explanation once modern humans entered their territories, leaving an evident logical gap. Before addressing this issue, the fundamental definition of the species concept must first be clarified.
Today, the species concept lacks sufficient precision and carries strong potential to mislead the general public. Fundamentally, it cannot draw unambiguous dividing lines between organisms; biological life‑forms in nature tend to exhibit blurred rather than discrete boundaries. The species concept attempts to describe a continuously evolving process using discrete units, inevitably generating numerous counter‑examples inconsistent with its definition. This long‑standing puzzle is widely known in evolutionary biology as the Species Problem.
This does not mean, however, that the species concept ought to be discarded entirely. From the perspective of Alexander Pyron, although a single universal criterion for defining species cannot be justified, species represent real‑world evolutionary entities possessing independent trajectories, rather than purely artificial human constructs. Blurred inter‑species boundaries do not signify a total absence of demarcation. Independent evolutionary trajectories can be observed across distinct biological groups. What is required is to accept that species represent segments cut from a continuous evolutionary spectrum. While applying the species concept, one must recognize that these divisions are imposed artificially upon an unbroken continuum. Even so, isolating mechanisms emerge within this continuous spectrum, generating stable genetic clusters that embark on independent evolutionary pathways, which constitutes the ontological foundation of the species concept.
An alternative framework is Alan Templeton’s Cohesion Species Concept, which defines a species as the largest evolutionary unit maintained as a unified whole through intrinsic cohesive mechanisms. Its core criterion lies in the presence of unique evolutionary cohesion, instead of relying primarily on reproductive isolation, the traditional benchmark for species delimitation. Under this framework, populations are not completely precluded from gene‑flow with external groups while retaining relative genetic coherence and continuity.
Accordingly, the value of the species concept does not lie in perfectly mirroring reality, but in furnishing an epistemic fulcrum that permits subsequent research to proceed, within an acceptable margin of informational loss. The problem arises not from deploying concepts that imperfectly represent reality, but from mistaking them for absolute ontological truths. Contemporary academic consensus favours applying divergent models across hierarchical scales; models need not be mutually consistent so long as each proves functionally valid within its own scope.
Traditional biological taxonomy principally relies upon reproductive isolation to differentiate species. In nature, however, reproductive isolation is rarely an absolute boundary and functions as a relative threshold, providing further evidence for ambiguities inherent to the species concept. Interspecific hybridization outcomes can be broadly classified into three categories:
The first outcome is complete sterility. This usually manifests as failed fertilization, high embryonic‑lethality rates, spontaneous maternal abortion, early post‑natal mortality, full sterility among surviving hybrid individuals, or hybrid offspring failing to reach sexual maturity.
The second outcome is partial fertility. Hybrid progeny reach sexual maturity, yet heterogametic males are typically sterile, while females remain capable of backcrossing with parental populations. Successive generations of backcrossing eventually yield relatively fertile descendants. Haldane’s Rule, formulated by J. B. S. Haldane, describes this pattern whereby the heterogametic sex among interspecies hybrids suffers elevated rates of lethality or sterility. Sporadic cases of female mule reproduction were documented as early as Aristotle’s era, with far more instances recorded in modern times, whereas no fertile male mule has ever been observed. Among mammals, hybrid males commonly exhibit asthenospermia, impaired spermatogenesis, elevated incidence of recessive hereditary disorders, and immunological incompatibility, collectively referred to as hybrid incompatibility.
Theodosius Dobzhansky regarded hybridization as a recurrent evolutionary event carrying both beneficial and deleterious consequences. After prolonged population divergence, genes develop co‑adapted configurations within their respective genetic backgrounds. Hybridization disrupts these established combinations, potentially reducing fitness and reproductive capacity, a mechanism central to Dobzhansky’s genetic‑incompatibility theory. In theory, hybridization may also expose recessive deleterious alleles in homozygous form, producing pathological phenotypes or genetic disease. This outcome, however, is not exclusive to interbreeding between distinct groups and can also arise within a single population. Consequently, the primary risk of hybridization is not the generation of hereditary disease, but systemic genetic discordance triggered by the breakdown of long‑established gene combinations.
The third outcome is full fertility among first‑generation hybrids, whose direct descendants remain fertile and interbreed indiscriminately with both parental species. Second‑generation hybrids and their progeny are capable of unlimited reproduction, mating freely with one another and with other hybrid descendants originating from the two parental populations, with no obvious fitness defects detectable.
Eugene M. McCarthy, originally a leading specialist in avian hybridization, has produced one of the world’s most comprehensive bodies of research on interspecies hybridization. He later compiled hybridization records across broader taxonomic groups and advanced the controversial‑to‑implausible‑pig‑ape‑hybrid hypothesis. Having reviewed most of his publications, I conclude that the majority of attempted inter‑species crosses fall within the first category, resulting in embryonic or neonatal mortality. Even so, abundant evidence confirms that cross‑species gene flow occurs widely in nature.
Many populations exhibit ring‑species dynamics: geographically adjacent populations interbreed freely and are taxonomically classified as conspecific, yet populations occupying opposite ends of the geographic ring develop partial reproductive isolation upon secondary contact. In such scenarios, the conventional species definition collapses, furnishing further proof that species represent continuously‑gradating evolutionary lineages rather than fixed taxonomic units.
Species boundaries therefore cannot be rigidly demarcated. Archaic hominins contributed substantially to the genetic makeup of modern human populations. Studies indicate that Australasian Indigenous peoples carry the world’s highest combined proportion of Neanderthal and Denisovan ancestry, demonstrating that archaic admixture impacted modern human groups unevenly. Interspecies hybridization events among hominins were frequent. My foundational migration framework thus favours the “Out of Africa Continuous Evolution with Admixture” model, rather than the strict traditional Out of Africa hypothesis.
When explaining physical disparities across human populations, lay readers and some traditional scholars invoke random genetic mutation, assuming that populations generate environment‑adapted mutations in response to local conditions such as temperature, ultraviolet radiation and humidity. This interpretation remains largely speculative, supported by scant empirical evidence, incomplete logical chains, and insufficient observational datasets.
Complex adaptive traits conferring local fitness advantages arise from the confluence of environmental conditions, historical contingency, and organism‑environment interactions. Such traits constitute low‑probability events that are rarely replicated, and their emergence cannot be guaranteed simply through extended temporal exposure. Once a population evolves an advantageous trait, the most efficient pathway for other groups to acquire the relevant alleles is not to await de‑novo mutation, but to obtain them via interbreeding, a process known as adaptive introgression.
This hybridization‑driven mode of trait acquisition aligns closely with Michael L. Arnold’s Reticulate‑Evolution model, which stands in contrast to the traditional tree‑like metaphor for evolutionary divergence. Declining genome‑sequencing costs in recent decades have uncovered widespread introgressed genetic segments between species, revealing that evolutionary history combines both tree‑like divergence and reticulate, hybridization‑mediated gene transfer, a pattern undetectable with older analytical technologies.
Phenotypic convergence can therefore arise through two distinct pathways. The first is convergent evolution, where separate populations evolve matching phenotypes under similar selective pressures, underpinned by partially overlapping genetic architectures. The second pathway involves acquiring identical alleles directly via gene‑flow or admixture. These two mechanisms operate synergistically. Under shared evolutionary constraints, life‑forms converge toward adaptive optima, with hybridization accelerating this process. Hybridization risk itself rises when distinct populations occupy comparable ecological niches and exhibit convergent behavioural and physical traits.
Compared with most of his contemporaries, Charles Darwin demonstrated a stronger capacity for identifying theoretical gaps and revising his arguments. In his later career, he did not deny widespread hybridization in nature. To explain hereditary mechanisms, he proposed Pangenesis as a supplementary framework for evolutionary theory, incorporating Lamarck’s doctrine of the inheritance of acquired characteristics. Pangenesis was subsequently superseded by Mendelian genetics. During the 1940s, genetic principles were integrated into evolutionary thought to produce the Modern Evolutionary Synthesis. The most recent major update, formalized after 2010, is the Extended Evolutionary Synthesis, which incorporates evolutionary developmental biology.
The long‑term morphological stasis of species is not an unfounded observation. Georges Cuvier inferred, from extensive fossil evidence, that species exhibited no physical transformation over time. Stephen Jay Gould advanced the theory of Punctuated Equilibrium. Sir William Lawrence maintained that climate and environment could not reshape human physical characteristics, which were governed exclusively by inherited genetics.
Key arguments advanced within Massimo Pigliucci’s Extended Evolutionary Synthesis identify two primary drivers of evolutionary change beyond de‑novo mutation. The first is differential gene regulation: trait expression can shift without alteration to the underlying DNA sequence. The second is inter‑population gene‑flow, where introgression and hybridization introduce exogenous alleles into recipient populations, recombining to generate novel phenotypes.
This perspective does not dismiss the foundational role of random mutation as the ultimate source of all genetic variation. Beneficial mutations, however, arise with extremely low frequency in nature and cannot function as the principal driver of complex‑trait evolution. Empirical observation far more commonly detects phenotypic shifts originating from altered gene regulation rather than structural gene mutation.
To illustrate this principle: suppose an individual with distinctive facial features migrates into a geographically distant community whose inhabitants exhibit markedly different craniofacial morphology. Over multiple generations, descendants may gradually converge phenotypically toward the local population and eventually become indistinguishable. This outcome should not automatically be attributed to environment‑driven mutation triggered by dietary shifts, humidity, temperature or other climatic variables. The far more plausible explanation is sustained intermarriage and gene‑flow between migrant descendants and residents, producing physical assimilation without requiring slow, complex mutational change.
This interpretive framework should also guide research on archaic human skeletal remains. When human fossils recovered from a single site, yet dated to distinct chronological phases, exhibit evidence of mixed physical ancestry, environment‑adaptation‑via‑mutation explanations ought to be set aside. Investigators should instead search for evidence of incoming populations whose admixture reshaped local biological profiles.
Long‑term directional selection can alter population physical characteristics, but this mechanism operates slowly and constitutes a distinct process separate from rapid gene‑flow‑driven change. When rapid morphological shifts are documented, admixture, rather than selection or mutation, represents the more parsimonious explanation. Since most random mutations are deleterious, the most reliable way for a community to acquire beneficial alleles is through gene‑exchange with populations already carrying those variants, rather than waiting for spontaneous mutation.
I therefore maintain a firm position regarding rapid physical transformations observed across geographically separated modern‑human populations, forming my third foundational framework: nearly all such changes derive from admixture, in other words gene‑flow or interbreeding, with negligible contribution from de‑novo mutation. Whenever fast‑paced morphological shifts are detected within a region, my working hypothesis presupposes the arrival of genetically distinct migrant populations. The primary investigative priority becomes identifying those incoming groups, rather than searching for local environmental triggers that supposedly induced mutation.
One final preliminary caveat concerns long‑chain integrative theories. Multi‑step arguments of this kind frequently lack unambiguous direct evidence and depend upon cumulative inference assembled from indirect clues. This limitation is shared across nearly all broad‑synthesizing theories, whether produced within institutional academia or by independent researchers. During the early developmental stages of new theoretical paradigms, indirect evidence often carries greater immediate importance than direct evidence. Without a framework capable of connecting disparate indirect observations, future direct evidence risks going unrecognized, misunderstood or ignored.
Paradigm‑building must therefore proceed even in the absence of conclusive direct evidence. Discovery of direct empirical validation generally follows theoretical construction, rather than preceding it. New interpretive frameworks enable researchers to “see” evidence that would otherwise remain invisible, even when such material has long existed within archaeological or genetic datasets.
This explains why I have chosen to publish this hypothesis at the present moment, before all direct evidence has been secured. Preliminary theoretical formulation guides targeted research capable of uncovering supporting material evidence in the future. Without prior hypothetical framing, archaeogenetic data demonstrating key migration events could remain unpublished due to a lack of explanatory context.
Concerning the evaluation of new hypotheses, uncritical acceptance or outright rejection both reflect weak reasoning capacity. Historical precedent repeatedly demonstrates that every novel explanatory model will eventually prove partially correct and partially erroneous over time. Researchers ought to retain logically consistent insights while discarding incorrect details and advancing inquiry. The presentation of innovative interpretive frameworks, and the capacity to recognize and engage with emerging paradigms, carry far greater significance than narrow‑minded judgements over whether a theory is “right” or “wrong”.
Main Text
Summary of Tribes in the Fringe Regions of Asia
Maternally‑Inherited Lineages of Andaman‑Island Populations and Their Relationships with Other Human Groups
The Andaman Islands are inhabited by two major linguistic groups: the northern‑oriented Great Andamanese‑language communities and the southern‑oriented Ongan‑language communities, also known as South‑Andaman‑speaking populations. The Great Andamanese maintained frequent contact with British colonizers starting from the late‑18th century and originally comprised more than a dozen tribes, including the Aka‑Cari, Aka‑Cora, Aka‑Bo, Aka‑Jeru, Aka‑Kede, Aka‑Kol, Oka‑Juwoi, Aka‑Pucikwar, Aka‑Bale and Aka‑Bea. Most of these tribes declined to near‑extinction by the mid‑to‑late 20th century under external pressures. Consequently, the contemporary group labelled “Great Andamanese” consists of only a tiny surviving fraction of the original array of Great‑Andaman‑language‑speaking communities.
Known or provisionally‑identified Ongan‑speaking populations include the Jangil, Jarawa, Onge and Sentinelese. The Jangil are extinct and therefore genetically unrecoverable. Research access to the Sentinelese is impossible because field expeditions cannot land on North‑Sentinel‑Island; their linguistic affiliation remains unconfirmed, yet geographic distribution and indirect evidence strongly suggest membership within the Ongan family. Concerning the phylogenetic relationship between the two Andaman‑Island language families, Joseph Greenberg once proposed that Great‑Andamanese belongs to a larger macro‑phylum together with West‑Papuan languages. Juliette Blevins and other linguists have advanced the hypothesis that Ongan shares common ancestry with Austronesian languages, although this claim remains controversial. Opposing scholars argue that observed linguistic similarities may stem from contact‑induced borrowing rather than deep shared origin.
Nonetheless, linguistic classification is not the primary objective of this discussion. It serves merely as a concise framework for untangling internal tribal relationships across the archipelago, enabling the detection of consistent maternal‑ and paternal‑lineage patterns. Genetically, modern Andaman‑Island communities are dominated by mitochondrial haplogroups M31 and M32. The subclade M31a1 is endemic to the Andaman Islands. Within this clade, Great Andamanese carry M31a1a, while the Onge of Little Andaman and the Jarawa of southern Andaman Island harbour its sister branch M31a1b. M31a1c has been sampled from Jarawa individuals, and M31a1d from Onge individuals1.
Sister branches of M31a1, namely M31a2 and M31a, appear among Indian populations whose dominant paternal haplogroups belong to F‑M89 sub‑lineages: R‑M124, J‑M172, H‑H69, O‑M95, plus a small proportion of F‑M89. These communities include the Lodha2, Chenchu and Lambadi3. M31a2‑bearing populations are also documented across Myanmar, particularly northern Myanmar, sporadically in southwest China, and on Sri‑Lanka. M31a2 represents apparently the only M31 sub‑clade recovered in Sri‑Lanka and eastern‑southeastern‑India4. The derivative M31a2a has been identified among the Pauri Bhuiya and Munda peoples. Limited sample sizes in early studies obscured the geographic location where M31a1 and M31a2 initially diverged; modern datasets place this split within Myanmar or northeastern‑India.
M31‑bearing individuals have also been sampled across the Indian states of Karnataka, Andhra Pradesh and Maharashtra. Among sub‑branches grouped under M31b’c, M31b occurs in the Rajbanshi population and West‑Bengal. Descendants of M31b1 are concentrated in Myanmar and along China‑Yunnan border communities, including the Achang and Jingpo, two Tibeto‑Burman‑speaking groups whose dominant paternal lineage is O2a2b1a1‑M1175. M31c is distributed across Nepal and northeastern‑India, reaching roughly 5 % frequency among the Khasi and approximately 17 % among the Bhoi6.
Within haplogroup M32, M32a is found in Onge and Jarawa, whereas its sister clade M32b occurs in Great‑Andamanese7. Outside the Andaman archipelago, scattered occurrences of M32 sub‑haplogroups have been reported on the southern Malay Peninsula. The sister branch M32c is largely restricted to Austronesian‑speaking inhabitants of Madagascar. Genetic evidence demonstrates that this population originated in the Philippine archipelago, paused briefly in western‑Indonesia during their expansion, and then migrated directly toward Madagascar. This migrant group carried maternal haplogroups B4a1a1a1a1 and its sister clade B4a1a1a1a2, alongside Philippine‑origin F3b1b* and its sub‑branches F3b1b2, F3b1b3 and F3b1b4. En route, they incorporated additional mitochondrial lineages originating from western‑Indonesia and southern‑Malay‑Peninsula populations before reaching Madagascar.
Beyond the dominant Andaman‑specific M31‑M32 maternal profile, Great‑Andamanese carry low‑frequency M3 and R22. R22 also appears among the Nicobarese who inhabit the Nicobar‑Islands, south of the Andamans. Nicobarese mitogenomes are marked by high‑frequency B5a and F1a1a1, intermediate‑frequency M74b, and low‑frequency M5c1 and M6a7. The Chao‑Lay communities living east of the Nicobar‑Islands, along Thailand’s western coastline, also contain F1a1a1 together with rarer M‑rooted haplogroups including D4e1a, E1a1a1a, M21b2, M46a, M50a1 and M71c8. Genome‑wide autosomal evidence reveals clear genetic separation between Nicobarese and Andaman‑Islanders: Onge and Jarawa cluster tightly together, with moderate genetic distance separating them from Great‑Andamanese, and all three Andaman‑related groups are distinctly divergent from Nicobarese9. Nicobarese genetically cluster with the Htin Mal, a Mon‑Khmer‑speaking population from Laos.
After eliminating R1a1‑M459 detected among Great‑Andamanese as a signal of recent‑admixture, their indigenous paternal‑lineage spectrum comprises sub‑clades descended from F‑M89: P‑M45, K‑M9, L‑M20, O‑M122 and O‑M9510. Unfortunately, no further coalescent‑age estimates have been generated for these branches. Using the common‑ancestor age between K1 (L‑M20), K2 (P‑M45) and O‑M175 within Great‑Andamanese yields an internal coalescence near 40 000 years before present, a value that provides little actionable information for dating human colonisation of the Andaman‑Islands.
By contrast, both Onge and Jarawa (Ongan‑language populations) share D1a2b‑Y34736, a downstream sub‑branch of D‑M174, whose internal coalescent age is approximately 3 400 years ago11. This date closely matches the ~3 200‑year coalescent estimate for maternal‑lineage M31a1 and is slightly older than the earliest archaeological shell‑midden sites on the Andaman‑Islands, whose currently‑reported chronology falls later than 3 000 years BP12. Zoo‑archaeological research has demonstrated that wild boar from the Andaman‑Islands belong to the same maternal‑lineage cluster as Burmese wild boar; these animals were introduced to the archipelago approximately 3 000 years ago alongside human migration, yielding yet another chronologically consistent data‑point13.
Early geneticists could not resolve whether M31 and M32 mitochondrial haplogroups observed across Andaman‑Islanders and South‑Asian populations reflected back‑migration from the Andamans toward the mainland. Current evidence rejects the hypothesis that M31b and M31a2 originated on‑island before returning to South‑Asia; instead, dispersal proceeded outward from South‑Asia. Consequently, Andaman‑Islanders (including populations of the southern Nicobar‑Islands) cannot be simplistically characterised as isolated relic populations of ancient humans14.
Paternal coalescent‑age analysis for Nicobarese yields an estimate of roughly 4 000 years BP for their core lineage O1b1a1a‑M9515. Collectively, these communities exhibit a pattern where many maternal sister‑clades are recurrently detected across South‑Asia and Indochina, while internal paternal coalescent times are tightly clustered within the 3 000‑4 000 years‑ago window. No equivalent paternal‑age data are yet available for Great‑Andamanese, yet their origin chronology is unlikely to deviate substantially from Ongan‑speaking groups and Nicobarese.
Archaeologically, the oldest securely‑dated shell‑midden sites on the Andaman‑Islands date to approximately 2 000 years BP. Andaman‑Islanders carry roughly 2 %‑4 % Neanderthal‑derived ancestry, consistent with other Out‑of‑Africa populations. Their Denisovan‑admixture proportion shows no statistically significant difference from typical East‑Asian values, setting them apart from Papuan‑Australian populations16.
Anthropologically, Andaman‑Islanders are conventionally classified as Negrito. Historically, the term “Negrito” originally designated short‑statured indigenous communities of the Philippine archipelago; the label was later extended to include Malay‑Peninsula foragers and Andaman‑Island inhabitants. Twentieth‑century researchers discovered that Philippine, Malay‑Peninsula and Andaman‑Island Negrito‑related groups are morphologically independent populations. Notably, Andaman‑Islanders display physical traits distinct from other canonical Negrito communities, and their languages form a family unrelated to those spoken by Philippine‑ or Malay‑Peninsula‑Negrito peoples.
Morphometric comparison across geographically‑separated Negrito‑phenotype populations reveals distinct skeletal patterns: Andaman‑Islanders generally possess relatively short humeri, Semang people of the Malay‑Peninsula exhibit short‑femur morphology, and Philippine Aeta populations have relatively short radii. During the 19th‑20th century, Western anthropologists widely interpreted these unique short‑stature adaptations as arising independently within each population17. By comparison, Hoabinhian populations distributed across southwest‑China and Indochina show closer skeletal affinity with Australian‑Melanesian groups and measurable morphological divergence from Andaman‑Islanders18.
Technological comparison between Andaman‑Island lithic industries and Hoabinhian assemblages draws on field‑notes compiled by Alfred Radcliffe‑Brown. Andaman‑Islanders produced abundant small stone‑blades, composite tools and tiny stone arrow‑points, while mastering the full operational sequence required to fell logs, hollow tree‑trunks and construct dugout‑canoes. This toolkit is clearly distinct from Sumatralith, the diagnostic artefact of Indochinese Hoabinhian culture, providing indirect evidence that Andaman‑Island lithic technology falls outside the Hoabinhian cultural sphere.
Height variation also exists internally among Andaman‑Island communities. Jarawa men stand approximately six centimetres taller than Onge males, whose average height reaches 1.48 m, and around 3.5 centimetres taller than Great‑Andamanese men, with a mean stature of 1.51 m19. In southern‑India, short‑statured, dark‑skinned, frizzly‑haired Kadar men were once labelled Negrito‑related. Their core paternal‑lineages are H1‑M52, F‑M89 and C‑M130, and male average height equals 1.56 m20. Carved motifs recovered on wooden combs manufactured by the Kadar suggest long‑term cultural connections with Negrito‑speaking groups of the Malay‑Peninsula and Philippine‑Islands. Egon von Eickstedt argued on morphological grounds that the Kadar are better candidates for representing the so‑called “continental prototype” Negrito population than Andaman‑Islanders21. Another South‑Asian community exhibiting comparable physical profiles is the Birhor, characterised by high frequencies of O‑M95 and H‑M69 paternal haplogroups22.
Phenotypes resembling Negrito short‑stature are not confined to the well‑studied Philippine‑Islands, Malay‑Peninsula, Andaman‑Islands and southern‑India. During the 19th‑20th centuries, numerous tribes displaying short‑stature morphology were documented across Indonesian‑islands and New‑Guinea. One example is the Aiome population inhabiting mountainous terrain west of Madang, whose dominant paternal‑lineage is K2b‑P331. Aiome men average 1.48 m and women 1.37 m; facial features, including broad mouths and protruding upper‑lips, show Australo‑Papuan affinities, skin colour ranges from light‑to‑dark‑brown, and the community maintains Neolithic material‑culture originating in the New‑Guinea highlands23. Low haemoglobin concentrations are common within this group, a trait recurrently observed among isolated forager societies24, and their stature closely matches the Andaman‑Islander average of 148.4 cm and the Aeta mean height of 147 cm.
Further short‑stature communities from western‑New‑Guinea include the Una and Ketengban populations, whose dominant paternal‑lineage is M‑M4; adult heights among these groups cluster around 1.5 m2526. Additional communities containing subsets of short‑statured Negrito‑like individuals are found in the Baliem‑Valley (Yali, Kosipe, Rampasasa) and within the Okapa district of the Eastern‑Highlands (Fore). Many of these populations share the distinctive chin‑reduction trait typical of Australo‑Papuan populations, a feature also identified in Homo floresiensis. By contrast, nearby groups dominated by S‑B254 (the immediate sister‑branch of M‑M4), such as the Huli, Gimi and Goroka, are large‑bodied, tall‑statured Papuan communities.
Negrito Populations of the Philippines and the Malay Peninsula
Negrito populations of the Philippine archipelago are conventionally divided into northern and southern groups. The northern cluster primarily comprises the Aeta of Luzon and various geographically‑dispersed related groups designated Ayta, Agta, Arta, Atta and Dumagat. Communities inhabiting western Luzon are referred to as Aeta, while those of eastern Luzon are called Agta; despite differing nomenclature, the two groups share common ancestry and are separated only by geography. Paternal genetic data corroborate this relationship, as both Aeta and Agta are dominated by the core paternal haplogroups K‑M9*, O‑M175, C‑M216 and P‑M4527. The southern Philippine Negrito cluster refers to populations south of Luzon, including the Batak of Palawan Island, the Ati of Cebu and Panay, and the Mamanwa of Mindanao.
One Aeta sub‑group, the Ayta Magbukon, was unexpectedly found in a prior study to carry the highest known proportion of Denisovan ancestry worldwide28, exceeding that of Papuan populations of Melanesia and Indigenous Australians by 30–40 %. The same study determined that Philippine Negrito groups began gene‑flow with Austronesian populations approximately 2 200 years ago, acquiring East‑Asian ancestry in the process. This admixture diluted a portion of their Denisovan component; the Ayta Magbukon may simply have missed sustained contact with Austronesian groups historically, incorporating less East‑Asian genetic material and thereby retaining elevated Denisovan ancestry. Furthermore, the Denisovan segments found in Philippine Negrito populations are not shared with those in Papuans, indicating that their respective ancestors admixed with distinct Denisovan lineages rather than a common source.
Negrito populations whose paternal structure differs from that of the Aeta include the Batak of Palawan, the Mamanwa, and the more southerly distributed Ati. All three are dominated by O‑M175. The Batak are characterised by core paternal haplogroups O1a2‑M110, O1a1‑P203 and O2a2‑P201, supplemented by minor frequencies of O1a‑M119, O‑M122 and K‑M9*29. Their maternal profile is dominated by M21a, with low‑frequency admixture of R21, B5a and B5b.
The Mamanwa carry core paternal haplogroups O‑M122 and O‑M119, with minor contributions from K‑M9, C‑M130, NO‑M214 and O‑M9530. The Ati are dominated by paternal haplogroups O‑M110, K‑M9 and C‑RPS4Y, supplemented by low frequencies of O‑M122, O‑M7 and O‑M134. Their maternal gene pool is led by Austronesian‑associated lineages, with approximately 60 % R9c together with F1a3, F3b2, M7c1c and Y2a1, plus minor frequencies of M19, M21c, M24 and M80, the latter being a sister branch of the mainstream East‑Asian D haplogroup. The downstream sub‑clade M21c1a is distributed across Luzon31.
Among Philippine Negrito groups such as the Aeta, Agta and Mamanwa, the R‑rooted maternal spectrum includes Austronesian‑introduced branches B4a1a, B4b1a, M7c3c, E1a1a, E1b1, Y2a1 and R9/F, alongside Melanesian‑characteristic P9 and P10, and finally low‑frequency minor Indochinese haplogroup M7b3. The Aeta and Agta also carry relatively high frequencies of M52 and M58, which research suggests may originate from India. The Mamanwa, by contrast, possess high frequencies of the distinctive N11, M7b3a, M7c3 and M74b132.
The indigenous populations of the Malay Peninsula include the Semang and Senoi, who exhibit Negrito‑like phenotypes, as well as the Proto‑Malay, who lack pronounced Negrito morphology and formed through admixture with Neolithic agriculturalists expanding southward from southern China. Among the Semang, the Maniq are almost exclusively dominated by paternal haplogroup K2b1‑P397, with a coalescent age of approximately 41 000 years. Their maternal lineages are led by M17a (coalescent age ~23 000 years), M21a (~18 000 years) and R21 (~9 000 years)33. The Maniq also carry an elevated risk of type‑2 diabetes, which some studies attribute to their relatively late adoption of agriculture34.
The Jahai, another Semang group, exhibit a genetic structure broadly similar to the Maniq. Within the Jahai, however, R2a‑L266 and R1a1a1b2a‑Z94 should be interpreted as recent admixture, while the detected K2b‑P331* represents the indigenous ancestral component. Their maternal pool features high‑frequency R21, N9a6 and M21a, alongside low‑frequency M21b. A further Semang branch, the Mendriq, has yielded only K2b1‑P397. Among their maternal lineages, R21 and F1a1a both show coalescent ages of approximately 8 000 years, considerably younger than M21a (~23 000 years) and M17a (~19 000 years)35.
Additional shared characteristics of Malay‑Peninsula Negrito groups such as the Semang and Senoi include high frequencies of M21a, identical to sample MA911 from the Gua Cha archaeological site, and its sister branch M21b, together with a small proportion of Neolithic‑era maternal haplogroups F1a1 and B5b1. The Semang and Senoi also carry anomalously high proportions of the minor R‑rooted branch R2136. Paternally, Semang and Senoi groups are broadly characterised by a mixture of O‑M175 and K‑M9. An obvious point of clarification is that labels such as Semang, Senoi and Aeta refer to population aggregates comprising multiple sub‑tribes, just as “Great Andamanese” denotes a collective of numerous tribes rather than a single community. Many Semang and Senoi sub‑tribes have therefore not yet been genetically sampled, yet since they belong to the same broader population, their maternal and paternal compositions are unlikely to differ substantially.
Comparison between ancient‑DNA results and modern populations indicates that these groups are among the contemporary populations retaining the highest proportion of Hoabinhian ancestry. In particular, the Maniq and Jahai have repeatedly been shown to be genetically very close to sample LA36837, and some studies have demonstrated strong genetic continuity between modern Malay‑Peninsula Semang populations and the Gua Cha site38, a pattern also evident from their geographic distribution and maternal lineages. Taking the two currently available late‑Hoabinhian samples, LA368 and MA911, as representative, one of the modern Southeast‑Asian populations retaining the greatest Hoabinhian legacy is the Malay‑Peninsula cluster comprising the Jahai, Bateq and Mendriq, whose maternal pool is overwhelmingly dominated by M21a, with B5b, M21b and R21 as secondary contributors.
Nevertheless, given that currently available Hoabinhian ancient samples are uniformly late in date and extremely limited in number, conclusions should remain provisional. Chronologically, the Hoabinhian cultural florescence spans approximately 8 000–15 000 years ago. Sample LA368 from the Pha Faen site in Laos, dated to ~7 000 years BP, falls on the eve of Hoabinhian decline. The later sample MA911 from the Gua Cha site in Malaysia, dated to ~3 900 years BP, belongs essentially to the terminal Hoabinhian period and the transition toward Neolithic technology in Indochina.
Across Indochina as a whole, the Hoabinhian entered formal decline from approximately 6 000 years ago. Ancient‑DNA evidence shows a sharp increase in the frequency of O1b1‑F2320, F1a1 and B5a1 in Vietnam, corresponding precisely to the rise of Austroasiatic‑speaking populations. Indeed, O1b1‑F2320 paternal lineages first appear in Indochina around 6 000 years ago, and the region gradually transitioned toward the Neolithic between 3 000 and 4 000 years ago.
The Hoabinhian cultural layer at Gua Cha begins approximately 8 000–9 000 years ago, with the Neolithic formally commencing around 3 000 years ago39. By the time MA911 lived, pottery, polished stone tools and Neolithic‑style burial customs had already appeared across much of the Malay Peninsula, making MA911 too recent a sample to fully represent the earlier Hoabinhian. From a morphological perspective, David Bulbeck examined several dozen skeletal remains from Gua Cha and concluded that the site’s inhabitants did not morphologically resemble typical Australo‑Melanesian Hoabinhian populations, nor were they close to local Southeast‑Asian groups; instead they presented a complex mosaic of traits40, which is in fact characteristic of a recently admixed population.
In terms of site quantity, the Hoabinhian culture, distributed across the region from southern China to Sumatra, has yielded nearly several hundred identified sites, with as many as 150 within Vietnam alone41. Earlier‑dated sites include Fodongdi (~18 000 years BP), Dedan (~20 000 years BP), Diem cave (~23 000 years BP)42, Hang Trong (~24 000 years BP), Con Moong (~25 000 years BP) and Tham Khuong (~30 000 years BP). The earliest attested Hoabinhian site is Xiaodong, dated to 24 000–43 000 years BP43, although none of these early sites have yet yielded ancient‑DNA data. Similarly, sample TBH1 from the late‑Hoabinhian Thung Binh 1 cave site in Ninh Binh province, northern Vietnam, dated to ~12 000 years BP, carried maternal haplogroup M59, while its paternal data were not published44. The 2025 discovery of the Pangpond child sample from Tham Din Cave in Thailand, dated to approximately 30 000 years BP, likewise lacks any genetic data.
Other sites, such as Manbac, are morphometrically strongly aligned with typical Hoabinhian remains. These important sites with well‑preserved skeletons amenable to genetic testing have likewise not yet yielded data. Consequently, the currently published samples, LA368 (~7 000 years BP, paternal C1b‑F1370, maternal M5; although M5 is primarily distributed in India, it also occurs in Nepal and northern Myanmar) and MA911 (~3 900 years BP, paternal D1b*‑TY92016, maternal M21b1a), are insufficient to support comprehensive research on the historical Hoabinhian as a whole. M21b1a, notably, remains a common maternal haplogroup among indigenous populations of Southeast Asia, including Indochina and the Malay Peninsula.
Some studies additionally hypothesise that the Mlabri are, like the Semang, direct descendants of Hoabinhian populations45. The Mlabri, however, have incorporated substantially more Neolithic ancestry from agriculturalists expanding southward from southern China, groups dominated by maternal haplogroup B5a1b1 (coalescent age ~1 000 years) and paternal haplogroups O1b1a1a1b‑M1283 and O1b1a1a1a1‑F292446. Genetically, the Mlabri are most closely related to the Seak, Soa and Bru of northeastern Thailand, who were similarly affected by this expansion. These populations are also more closely related to modern Malays, whose paternal pool is dominated by O‑M175 with minor contributions from C1b1a2‑B65, C1b1a2b‑F725, C1b2a‑M38, F2‑M427, S‑B254 and P‑M45 (18 %)47.
Proto‑Malay populations represented by the Mlabri differ from Malay‑Peninsula Negrito groups in being formed primarily through admixture between two ancestral components. For instance, the Jakun possess a basal layer of Malay‑Peninsula hunter‑gatherer ancestry related to Hoabinhian‑associated Semang and Senoi populations, overlaid by East‑Asian ancestry introduced through large‑scale migration of Neolithic rice‑farming populations from southern China48, i.e. an admixture of the two. Maternally, this is reflected in the Jakun gene pool comprising approximately 50 % F1a1a and 50 % M*. Modern Malays can be modelled as an admixture of Malay indigenous populations, southern‑Chinese Neolithic migrants and more recent Indian trading‑community migrants, with the first two components contributing the largest shares and exhibiting clear maternal‑lineage differentiation49. This also explains why the Maniq, a Semang sub‑group, carry approximately 35 % East‑Asian‑related ancestry, introduced by later agricultural populations, alongside 65 % Hoabinhian‑related admixture.
Proto‑Malay populations such as the Semelai and Temuan are maternally characterised by high frequencies of B5a and F1a1 introduced by later Austroasiatic groups, R21 and N9a6 brought by earlier migrations from Indochina, sister branches of the M21 cluster (M21b, M21a, M21c), and Austronesian‑associated M7c1.
Other Proto‑Malay groups, such as the Kanaq and Seletar, currently lack published maternal data but are expected to show similar profiles. Subsequent modern Malay populations, building upon this foundation, added further haplogroups including B4c, C, D, E, F3, H, M7b, M12, P, Q, R9 and Y2, the last of which should refer to the Austronesian‑specific Y2a1.
R21 and R22 both belong to minor R‑rooted maternal branches in Southeast Asia, where their overall presence is less prominent than that of the earlier M‑rooted lineages and the later‑arriving B and R9/F. Their internal coalescent ages are notably younger than those of M‑rooted branches, possibly because these lineages arrived too late to secure the geographic priority held by earlier M haplogroups, while also lacking the full agricultural advantage carried by the B and R9/F lineages of later Austroasiatic and Austronesian populations.
Regarding the physical appearance of Proto‑Malay populations across Southeast Asia, including the Malay Peninsula, Borneo, the Philippine archipelago and the entire Indonesian archipelago, numerous Western explorers and anthropologists active between the 18th and 20th centuries documented marginal tribes across the Indonesian islands, Malay Peninsula, Borneo, Philippines, Sumatra, Java and the Lesser Sunda Islands. Surviving textual and illustrative materials are richer than commonly assumed. Shared descriptive accounts generally record: low and rounded foreheads; very broad, flat and flared noses; full cheeks with indistinct cheekbones; rounded eyes; poorly‑developed, blunt chins; variable lip size, sometimes everted; and sparse, thin and irregular body hair.
Genetic Composition of New Guinea and Australia
Historically, the Oceanian populations located further to the southeast, namely the Melanesians and the Indigenous peoples of the former Sahul continent encompassing Australia and New Guinea, engaged in limited gene‑flow with the Indonesian archipelago of Southeast Asia. Paternally, aside from shared concentration within CF‑P143, these populations differ somewhat from Proto‑Malay groups. For instance, Indigenous Australians across many regions exhibit high frequencies of the CF‑P143 sub‑clades C1b2b‑M347, K2‑M526 and S‑B254, alongside lower frequencies of C‑M130 and M‑Z3084050. Excluding the Austronesian Lapita branches O‑M119 and O‑M122, which have continuously admixed into the lowland coastal regions of New Guinea over the past 3 500 years, the paternal lineages of Papuan New Guineans are highly concentrated in K‑M9 (descended from F‑M89), S‑B254 and M‑Z30840 (descended from K2b1‑P397), plus a proportion of C‑M3851.
K2b1‑P397 is almost exclusively restricted to eastern Indonesia, Oceania, Indigenous Australians and the Philippine Aeta. Within this clade, K2b1a1‑P308 is found only in Australia. K2c‑P261, K2d‑P402 and K2e‑M147, which diverged contemporaneously with K2a‑M214 (NO) and K2b‑P331 (PQR), are widely distributed across the Indonesian archipelago at extremely low frequencies52. Consequently, the diversity of CF‑P143 in Southeast Asia appears slightly higher than in Oceania, suggesting that Oceania may represent merely an extension of this diversity. STR diversity of C‑M38* likewise reaches its highest frequency in eastern Indonesia rather than in Melanesia; its downstream sub‑clade C‑M208 is restricted to Melanesia and Pacific islands53. Furthermore, the diversity of M‑P34 and S‑M254 in eastern Indonesia exceeds that observed in New Guinea.
Maternally, B4a1a and E1a are not indigenous to northern Sahul. The Sahul region is dominated by Q and P maternal haplogroups, with low‑frequency M27, M28 and M29, plus extremely rare R14 and M73 originating from northern Sahul. Indigenous Australians, whose paternal pool is dominated by C1b2‑Z31885, primarily carry N‑rooted maternal haplogroups N13, N14, O, S1 and S2. Papuans, dominated by paternal K2b‑P331, M‑Z30840 and S‑B254, primarily carry M‑rooted sub‑clades M15, M27, M28 and M29’Q54, while very low frequencies of R‑rooted R12 and P‑rooted haplogroups are distributed among both Indigenous Australians and Papuans55. Among these, P3a and P4b occur in Australia, whereas P3b and P4a are found in New Guinea, indicating sustained prehistoric gene‑flow between Sahul and Australia56.
This pattern of inter‑regional exchange extends beyond these two regions. Downstream sub‑clades M42a and M42c are restricted to Australia, yet M42b occurs among tribal populations of southern India, with studies placing their divergence time at over 55 000 years ago. Within M42’74, the sister clade of M42, M74 also appears in the Goyet Q376‑3 sample from Bulgaria, dated to 35 000 years BP, which carried paternal C‑M130* and maternal M74.
Unfortunately, ancient‑DNA data for Melanesian and Indigenous Australian populations remain extremely scarce. Key samples from the latter have been reburied by modern Indigenous Australian communities. The earliest published ancient DNA from Indonesia currently available is a single specimen: Besséʼ, a 17–18‑year‑old female belonging to the Toalean culture, recovered from Leang Panninge (Bat Cave) in South Sulawesi and dated to 7 200 years BP, whose maternal haplogroup is M*57.
Human Remains from Southwest China and Ancient Southern China
Among currently excavated Chinese archaeological sites, populations exhibiting cranial morphological affinities with Australo‑Melanesians include, besides the ancient Fujian samples Qihedong 3 and Tanshishan, and the Guangxi Dingsishan culture, the relatively well‑known Liangdao 1 individual, who carried paternal O1a1b‑CTS5726 and maternal E1. Craniofacially and dentally, this individual belongs to the Papuan‑Australian type, i.e. Australo‑Melanesian58, accompanied by short stature, the flexed lateral burial posture characteristic only of early southern‑Chinese indigenous populations, dark skin, flared cheekbones and a flat facial profile. Correspondingly, another male sample from the Qihe cave site in ancient Fujian, as well as the M7b1a1‑bearing population from the Daxie site in Ningbo, both exhibit short, robust builds, coarse morphology and flared cheekbones.
Six hundred years later, the female individual Liangdao 2, identified in one study as carrying the R9 sub‑branch R9c1*59, departs markedly from Australo‑Melanesian morphological traits in physical‑anthropological terms. Her cranium leans toward modern East‑Asian morphology, and her height approaches 1.7 m. The Liangdao population subsequently underwent abrupt, direct transformations across physical morphology, lithic technology and cultural customs, with no apparent transitional phase. Paternal lineages remained unchanged, while maternal lineages shifted from M‑rooted to R9‑rooted haplogroups, evidently deriving from distinct sources.
The later‑dated Liangdao 2 carries more modern northern‑East‑Asian ancestry than Liangdao 160, and its affinity with Hoabinhian populations is weaker than that of Yangshao culture, ancient Shandong populations and modern northern Han Chinese. This indicates that Liangdao 2 incorporated even less basal East‑Asian ancestry than northern‑East‑Asian populations, whereas Liangdao 1 and Qihedong 3 clearly do not follow this pattern. It is now reasonably established that R9 maternal haplogroups diffused across East Asia later than M and E haplogroups, and that R9 lineages were incorporated into the paternal population of Liangdao 1 only toward the onset of the Neolithic. The Qihe cave site, located southwest of Liangdao and earlier in date, likewise underwent a transition from E to R9 maternal haplogroups accompanied by simultaneous morphological and cultural transformation.
The ancient Liangdao population therefore represents a crucial intermediate ancestral group formed through admixture between southward‑expanding prehistoric northern‑East‑Asian components and indigenous coastal southern‑Chinese populations, prior to further dispersal toward Taiwan and the Philippine archipelago. Later Taiwanese Indigenous peoples such as the Amis and Atayal also exhibit ancestry related to northern East Asia, specifically Neolithic populations from the Gansu‑Qinghai and upper Yellow River regions, contrasting with the lesser admixture observed among the Igorot of Luzon in the Philippines. Beyond the Philippines, a female individual recovered from the Xiaoma cave site in Taiwan, standing approximately 1.4 m tall with a cranium resembling those of Negrito populations within the Philippine archipelago, demonstrates at minimum that Negrito‑like populations of substantial size once inhabited Taiwan several thousand years ago61.
A further key distinction between Liangdao 1 and Liangdao 2 is that the latter carries the mainstream East‑Asian light‑skin allele OCA2 rs1800414, whereas the 8 000‑year‑old Liangdao 1 does not. This allele is detected only in the 7 000‑year‑old Liangdao 2, despite having originated nearly 10 000 years ago. Consequently, the earlier view that OCA2 rs1800414 arose among Austronesian populations and spread northward is demonstrably inaccurate, since the older Liangdao 1 individual does not carry it.
In Europe, the OCA2 gene influences iris colour, whereas in East Asia it governs light skin pigmentation. Prior to the diffusion of R9, the earlier E‑rooted maternal populations did not carry the East‑Asian OCA2 light‑skin allele; neither did the early southwestern populations carrying M9, M71 or M61 maternal haplogroups. Subsequently, as R9/F and B maternal lineages expanded and became dominant, this allele became widespread. Even so, Austroasiatic populations such as the Wa, who have now incorporated F1a1 and B5a1 maternal haplogroups, still tend toward darker skin pigmentation, although their cranial morphology is already predominantly modern.
Among currently available ancient samples, the OCA2 rs1800414 mutation has been confirmed in Liangdao 2, and the F23 Jōmon individual from the Funadomari site in Japan, dated to 3 800 years BP, likewise carries the rs1800414 C/T heterozygous genotype. By contrast, this mutation did not begin to increase markedly in frequency in northern East Asia until the late Holocene, spreading rapidly over the past approximately 2 000–3 000 years. Meanwhile, the derived rs1800414 allele is essentially absent in Oceanian regions dominated by K2b‑P331 and C1b‑F1370.
Qihedong 3, closely related to the Liangdao population, was initially designated as carrying maternal R9c1b in the official publication62. Subsequent independent analyses of raw data by non‑institutional researchers, however, revealed a numbering discrepancy between Qihedong 3 and Qihedong 2: Qihedong 3 (qihe3), dated to 11 700 years BP, should carry maternal E* with no paternal haplogroup determined, whereas Qihedong 2 (qihe2), dated to 8 400 years BP, carries maternal R9c1b. The older Qihedong 3 exhibits a mosaic of traits combining Neolithic southern and northern populations with Late Pleistocene humans63: a tall and narrow face, mesoconch orbits, broad and low nasal bones, a long and large cranium with thin bone walls, non‑projecting glabella, prominent cheekbones, a flat upper face and a slender mandible, presenting a “mosaic morphology” combining archaic and modern features.
The later‑dated female Qihedong 2 possessed a complete Neolithic technological repertoire, subsisted primarily on cereal grains, and ranked among the taller adult female individuals of Neolithic southern China64. By contrast, the male Qihedong 3 shows no traces of Neolithic technology, is shorter in stature, consumed no cereals and suffered from diabetes. The relationship between these two individuals parallels the structure observed among the Fujian Liangdao population, and the genome‑wide ancestry of the Qihe population as a whole is also close to that of Liangdao65. At the same geographic location but different chronological periods, they exhibit distinct lithic technologies and physical traits, structured by the earlier E maternal haplogroup and the later R9 maternal haplogroup. The only difference is that the two Qihe samples are separated by approximately 3 000 years, whereas the two Liangdao samples differ by only a few hundred years. The maternal transition at Qihe foreshadows the maternal transition at Liangdao: the switch in maternal lineages not only directly altered physical morphology but also transformed technology and subsistence, while population size expanded substantially.
Beyond its genetic connections with ancient southern‑Chinese samples such as Liangdao 1 and Qihedong, Liangdao 2 also exhibits, according to currently available data, an anomalous association with a relatively marginal tribal population: the Onge of the Andaman Islands. Before addressing this, certain background context should be recalled. As noted earlier, when British colonizers landed on the Andaman Islands, the numerous Great‑Andamanese‑language tribes, being closest to the landing sites, suffered the severest losses, declining to near‑extinction by the late 20th century. Conversely, the Ongan‑language populations of the southern Andaman Islands, protected by their geographic location, retained relatively larger populations. Subsequently, because the Onge of Little Andaman were more accessible for sampling and the island offered natural isolation, they became the representative Andaman population in molecular‑anthropological publications. It must be emphasised, however, that the Onge constitute only one among many Andaman tribes; the conclusions presented below may therefore apply solely to the Onge rather than to Andaman Islanders as a whole, or alternatively may indeed apply to the entire Andaman population.
The situation is roughly as follows. In certain studies, within specific f4/qpGraph models, Liangdao 2 and the Onge exhibit pronounced additional affinity66. For instance, in Wang et al. 2021, Liangdao 2 can be directly modelled as comprising approximately 27 % Onge‑related ancestry. The complication is that Liangdao 2 is not closely related to Hoabinhian populations67, whereas the Onge are very close to Hoabinhian populations in nearly all studies. At least two relatively straightforward explanations exist for this pattern. First, the Onge themselves may represent a recently admixed structure, having incorporated an East‑Asian‑related component. Second, the Onge and Liangdao 2 may share a deeper ancestral branch, both inheriting ancestry from an as‑yet‑unsampled deep ghost population of southern East Asia, with the Onge subsequently acquiring greater Hoabinhian‑related ancestry, such that the Onge can ultimately be modelled as an admixture of Hoabinhian and Liangdao‑2‑related populations.
If the first explanation is adopted, one may further infer that the Onge incorporated an East‑Asian‑derived population in recent times, or that a Liangdao‑2‑like group migrated southward and admixed extensively with Hoabinhian‑related autosomal ancestry to form the Onge. Equivalently, this could be interpreted as a purely Hoabinhian‑related population coming into contact with a southward‑moving Liangdao‑2‑like group in recent times. As noted earlier, because Andaman‑Islands research has focused predominantly on the Onge, patterns observed among the Onge cannot be directly extrapolated to other Andaman populations, particularly the Great Andamanese, who are more distant from the Onge. Whether all Andaman Islanders share this trait, or whether it is restricted to Ongan‑language populations related to the Onge, remains to be determined once future research compares Great Andamanese, Jarawa and Liangdao 2.
The Dushan individual, dated to nearly 9 000 years BP and carrying maternal B4a1e and paternal O2a2a1a2a1a1‑F1275, possessed a full taro‑agricultural system, stone grinders and domesticated chickens, yet exhibits a recently admixed state represented by Fujian Qihedong ancestry combined with northern‑eastern coastal Chinese components. Although the Dushan individual predates the 6 000‑year‑old Xingyi site M61 maternal sample and the 8 000‑year‑old Liangdao 1 E1 maternal sample, its technology and culture comprehensively surpass both, demonstrating once again that technological evolution bears no direct correspondence to chronological recency.
The M9‑bearing Maludong individual from Yunnan exhibits, according to morphometric assessment, a mixture of archaic and modern human traits. This morphology most likely arose through admixture with archaic humans. Genetically, the 14 000‑year‑old Maludong individual shows the strongest genetic continuity with ancient and modern populations of southern China and Southeast Asia, and weaker affinities with northern populations68. Unfortunately, no male samples are currently available from early southwestern‑China ancient populations: the Yunnan Maludong M9 individual, the Guangxi Longlin M71 individual, and the Guizhou Qingshuiyuan M71 individual69 are all female. A site exhibiting cranial similarities to the Guangxi Longlin individual is the Mopanshan site in Yuanmou County, Chuxiong, Yunnan, where the sample, designated Mopanshan_M3, is likewise a female carrying maternal M13a1b, a downstream sub‑clade of M.
The early Neolithic Xingyi site sample, designated Xingyi_H4 and dated to 7 100 years BP, carries maternal M61a70 and shows no traces of pottery or microlithic technology. By contrast, the later late‑Neolithic Xingyi site, dated to 4 000 years BP, yields high frequencies of maternal M75, and sites across Xingyi and other late‑Neolithic central Yunnan locations exhibit co‑occurrence of M75 and F1a1 maternal haplogroups. Paternally, these populations are dominated by O1b1a1a‑M95. Technology and physical morphology underwent dramatic transformation accompanied by signs of recent admixture, together with the introduction of a mature Neolithic technological package including pottery production and rice agriculture. The later F1a1 maternal haplogroup also maintains high frequency among modern Austroasiatic populations of Indochina, whereas the frequencies of M75, M61 and related haplogroups have declined substantially in modern populations. The Xingyi site clearly underwent a dramatic restructuring of its maternal lineage composition between the late Neolithic and the Bronze Age. These abrupt morphological and technological transformations were not autogenous but were driven by the influx of external populations, which compelled the indigenous population to undergo comprehensive transformation.
The sister branch of M75, M23, is now largely distributed in Madagascar. It is possible that M75 initially migrated westward along the southeastern coast into Guangxi, after which the M23 maternal lineage, having passed through a bottleneck, migrated to Madagascar alongside B4a1a1b, F3b1b3 and M7c1c3. Although the Xingyi site where M75 was detected lies in southeastern Yunnan, M75 maternal haplogroups can be considered essentially absent among Tibeto‑Burman populations, particularly the more westerly and higher‑altitude Tibetans.
In terms of autosomal composition, Xingyi_EN (early‑Neolithic Xingyi component) and Xingyi_LN (late‑Neolithic Xingyi component) do not exhibit close affinity with ancient East‑Asian populations; the latter does not carry the ancestral component of the former, providing further evidence of population replacement. Available data indicate that replacement occurred primarily among maternal lineages. Ancient Fujian on the southeastern coast has already demonstrated the comprehensive transformations triggered by maternal lineage shifts. Both southeastern and southwestern China experienced sudden leaps between 6 000 and 9 000 years ago during the Neolithic, with morphological changes accompanied by the introduction of external lithic technologies. Molecular‑anthropological data reveal this as a switch in dominant maternal lineages, consistent with conclusions from physical anthropology.
Xingyi_EN was initially defined as a ghost ancestral population related to ancient Qinghai‑Tibet Plateau populations. If northern‑East‑Asian Yellow River populations are defined as an admixture of Shimao_LN (late‑Neolithic Shimao component) and Liangdao 2, then modern Tibetans can be modelled as 85–90 % northern‑East‑Asian Yellow River ancestry plus 10–15 % Xingyi_EN. Unfortunately, ancient samples carrying high Xingyi_EN proportions remain scarce. Besides the Guangxi Longlin individual, who can be modelled as 50 % Xingyi_EN admixed with 50 % ancient Fujian Qihedong 3, one recently reported individual from the Mabu Co site in southern Tibet, dated to 3 500 years BP and carrying paternal C2b1b1‑CTS10923 and maternal D4j1b71, can be modelled as approximately 60 % Xingyi_EN‑related and 40 % northern‑East‑Asian ancestry, making it one of the ancient‑DNA samples with the highest known Xingyi_EN proportion.
Beyond samples directly related to ancient Qinghai‑Tibet Plateau populations, the deep ancestry represented by Xingyi_EN has left varying degrees of genetic traces among other prehistoric populations of southern East Asia. For instance, late‑Neolithic Fujian populations such as Tanshishan exhibit elevated shared drift with Xingyi_EN in some genetic statistics, although this affinity cannot be directly equated with explicit Xingyi_EN introgression. The approximately 11 000‑year‑old Guangxi Longlin individual already yields a detectable Xingyi_EN ancestral component. By contrast, related ancient populations represented by upper‑Yellow‑River groups such as the Qijia‑culture Lajia site are overall closer to northern‑East‑Asian populations and do not exhibit the pronounced Xingyi_EN ancestry seen among ancient Plateau populations.
Non‑Plateau populations such as the Han, Yi, Naxi, Naga, as well as the Dali Bai and Nujiang Pumi of Yunnan, generally carry high levels of northern‑East‑Asian ancestry. For example, the modern Nujiang Pumi, who carry a certain proportion of D1a1b1‑P47 paternal lineages, can be modelled as 85 % northern‑East‑Asian ancestry and 15 % Xingyi_EN. Among various late‑Neolithic to Bronze‑Age sites in central Yunnan, the Gaozhai site72, which is best modelled as an admixture of two northern‑East‑Asian ancestral components (AR14K and Shimao_LN) with Xingyi_LN‑related ancestry, yields high frequencies of paternal D1a1b1‑P47.
The more southerly distributed Honghe Hani exhibit greater central‑Yunnan ancestry. Comparing Dali Bai and Honghe Hani, both groups can be modelled as admixtures of Shimao_LN and Xingyi_LN‑related ancestry, yet the Dali Bai carry a larger northern‑East‑Asian ancestral component than the Honghe Hani. The paternal difference between the two groups is that the Dali Bai yield approximately 10 % D1a1a1a1‑Z27269 paternal lineages, whereas the Honghe Hani do not.
The Karen of Thailand, and Austroasiatic populations including the Blang and Wa, share greater ancestry with Xingyi_LN (central‑Yunnan ancestry) than with northern‑East‑Asian ancestry. The Wa, dominated by paternal O2a2b1a1‑M117 and O1b1a1a‑M95, and the Mang, dominated by paternal O1b‑M268, carry higher levels of nearly 90 % Xingyi_LN component and lower northern‑East‑Asian ancestry. Kra‑Dai populations can be modelled as approximately 60 % Liangdao 2, 30 % Xingyi_LN and 10 % northern‑East‑Asian. Austroasiatic populations can be modelled as 50 % Xingyi_LN, 25 % Hoabinhian component represented by LA368, and 25 % northern‑East‑Asian. Among Indochinese Semang and Senoi sub‑tribes dominated by K2b and O‑M175, such as the Bateq, CheWong, Jahai, Kintaq and Mendriq, genetic profiles reflect admixture between Xingyi_LN and LA368‑related ancestry.
References
[1] Maji S, Krithika S, Vasulu T S. Phylogeographic distribution of mitochondrial DNA macrohaplogroup M in India[J]. Journal of Genetics, 2009, 88(1): 127-139.
[2] Thangaraj K, Chaubey G, Kivisild T, et al. Maternal Footprints of Southeast Asians in North India[J]. Human Heredity, 2008, 66(1): 1-9.
[3] Endicott P, Metspalu M, Stringer C, et al. Multiplexed SNP Typing of Ancient DNA Clarifies the Origin of Andaman mtDNA Haplogroups amongst South Asian Tribal Populations[J]. PLoS ONE, 2006, 1(1): e81.
[4] Wang H W, Mitra B, Chaudhuri T K, et al. Mitochondrial DNA evidence supports northeast Indian origin of the aboriginal Andamanese in the Late Paleolithic[J]. Journal of Genetics and Genomics, 2011, 38(3): 117-122.
[5] Barik S S, Sahani R, Prasad B V R, et al. Detailed mtDNA genotypes permit a reassessment of the settlement and population structure of the Andaman Islands[J]. American Journal of Physical Anthropology, 2008, 136(1): 19-27.
[6] Sitalaximi T, Varghese N, Kashyap V K. Genetic differentiation of Andaman Islanders and their relatedness to Nicobar Islanders[J]. Human Gene, 2023, 35: 201148.
[7] Sitalaximi T, Varghese N, Kashyap V K. Genetic differentiation of Andaman Islanders and their relatedness to Nicobar Islanders[J]. Human Gene, 2023, 35: 201148.
[8] Kutanan W, Srikummool M, Kampuansai J, et al. Maternal genetic origin of Chao Lay coastal maritime populations from Thailand[J]. BMC Biology, 2025, 23(1): 45.
[9] Thangaraj K, Singh L, Reddy A G, et al. Unique origin of Andaman Islanders: insight from autosomal loci[J]. Journal of Human Genetics, 2006, 51(8): 800-804.
[10] Thangaraj K, Singh L, Reddy A G, et al. Genetic Affinities of the Andaman Islanders, a Vanishing Human Population[J]. Current Biology, 2003, 13(2): 86-93.
[11] Sitalaximi T, Varghese N, Kashyap V K. Genetic differentiation of Andaman Islanders and their relatedness to Nicobar Islanders[J]. Human Gene, 2023, 35: 201148.
[12] Cooper Z. Analysis of the nature of contacts with the Andaman Islands during the last two millennia[J]. South Asian Studies, 1989, 5: 133-147.
[13] De A K, Sawhney S, Jeyakumar S, et al. First Account on Maternal Lineage of Andaman Wild Boar (Moupin Pig), an Endangered Endemic Species of Andaman Archipelago[J]. Exploratory Animal and Medical Research, 2022, 12(1): 54-68.
[14] Chaubey G, Endicott P. The Andaman Islanders in a Regional Genetic Context: Reexamining the Evidence for an Early Peopling of the Archipelago from South Asia[J]. Human Biology, 2013, 85(1-3): 153-172.
[15] Mishra R K, Singh P P, Rai N, et al. Reconstructing the population history of the Nicobarese[J]. European Journal of Human Genetics, 2024, 32(12): 1875–1883.
[16] Mondal M, Casals F, Xu T, et al. Genomic analysis of Andamanese provides insights into ancient human migration into Asia and adaptation[J]. Nature Genetics, 2016, 48(9): 1066-1070.
[17] BANERJEE, A. R. 1957: Further histological studies on Negrito hair: the Onges of the Andaman Islands. Man in India, 37: 249-256.
[18] Matsumura H, Yoneda M, Dodo Y, et al. Terminal Pleistocene human skeleton from Hang Cho Cave, northern Vietnam: implications for the biological affinities of Hoabinhian people[J]. Anthropological Science, 2008, 116(3): 201-217.
[19] Sitalaximi T, Varghese N, Kashyap V K. Genetic differentiation of Andaman Islanders and their relatedness to Nicobar Islanders[J]. Human Gene, 2023, 35: 201148.
[20] ArunKumar G, Soria-Hernanz D F, Kavitha V J, et al. Population Differentiation of Southern Indian Male Lineages Correlates with Agricultural Expansions Predating the Caste System[J]. PLoS ONE, 2012, 7(11): e50269.
[21] Gates R R. The Melanesian dwarf tribe of Aiome, New Guinea[J]. Acta Geneticae Medicae et Gemellologiae, 1961, 10(3): 277-311.
[22] Kumar V, Reddy A N S, Babu J P, et al. Y-chromosome evidence suggests a common paternal heritage of Austro-Asiatic populations[J]. BMC Evolutionary Biology, 2007, 7(1): 47.
[23] Moyne L, Haddon K. The pygmies of the Aiome Mountains, Mandated Territory of New Guinea[J]. The Journal of the Royal Anthropological Institute of Great Britain and Ireland, 1936, 66: 269-290.
[24] Champness L T, Kooptzoff O, Walsh R J. A STUDY OF THE POPULATION NEAR AIOME, NEW GUINEA[J]. Oceania, 1960, 30(3): 209-222.
[25] Kayser M, Brauer S, Weiss G, et al. Reduced Y-Chromosome, but Not Mitochondrial DNA, Diversity in Human Populations from West New Guinea[J]. American Journal of Human Genetics, 2003, 72(2): 281-302.
[26] Tommaseo-Ponzetta M, Mona S, Calabrese F, et al. Mountain pygmies of Western New Guinea: A morphological and molecular approach[J]. Human Biology, 2013, 85(1-3): 285-308.
[27] Heyer E, Georges M, Pachner M, et al. Genetic diversity of four Filipino Negrito populations from Luzon: comparison of male and female effective population sizes and differential integration of immigrants into Aeta and Agta communities[J]. Human Biology, 2013, 85(1-3): 189-208.
[28] Larena M, McKenna J, Sanchez-Quinto F, et al. Philippine Ayta possess the highest level of Denisovan ancestry in the world[J]. Current Biology, 2021, 31(19): 4219-4230.e10.
[29] Scholes C, Siddle K, Ducourneau A, et al. Genetic diversity and evidence for population admixture in Batak Negritos from Palawan[J]. American Journal of Physical Anthropology, 2011, 146(1): 62-72.
[30] Delfin F, Salvador J M, Calacal G C, et al. The Y-chromosome landscape of the Philippines: extensive heterogeneity and varying genetic affinities of Negrito and non-Negrito groups[J]. European Journal of Human Genetics, 2011, 19(2): 224–230.
[31] Tabbada K A, Trejaut J, Loo J H, et al. Philippine mitochondrial DNA diversity: a populated viaduct between Taiwan and Indonesia?[J]. Molecular Biology and Evolution, 2010, 27(1): 21–31.
[32] Delfin F, Ko A M S, Li M, et al. Complete mtDNA genomes of Filipino ethnolinguistic groups: a melting pot of recent and ancient lineages in the Asia-Pacific region[J]. European Journal of Human Genetics, 2014, 22(2): 228-237.
[33] Kutanan W, Kampuansai J, Changmai P, et al. Contrasting maternal and paternal genetic variation of hunter-gatherer groups in Thailand[J]. Scientific Reports, 2018, 8(1): 1976.
[34] Herzog T, Larena M, Kutanan W, et al. Natural selection and adaptive traits in the Maniq, a nomadic hunter-gatherer society from Mainland Southeast Asia[J]. Scientific Reports, 2025, 15(1):4123.
[35] Aghakhanian F, Hoh B P, Yew C W, et al. Sequence analyses of Malaysian Indigenous communities reveal historical admixture between Hoabinhian hunter‑gatherers and Neolithic farmers[J]. Scientific Reports, 2022, 12(1): 13578.
[36] Hill C, Soares P, Mormina M, et al. Phylogeography and Ethnogenesis of Aboriginal Southeast Asians[J]. Molecular Biology and Evolution, 2006, 23(12): 2480-2491.
[37] Yang M A. A genetic history of migration, diversification, and admixture in Asia[J]. Human Population Genetics and Genomics, 2022, 2(1): 1-32.
[38] Higham C F W. Hunter-Gatherers in Southeast Asia: From Prehistory to the Present[M]//Bellwood P, Renfrew C. The Global Prehistory of Human Migration. Oxford: Wiley-Blackwell, 2014: 227–243.
[39] Adi Haji Taha. Gua Cha and the archaeology of the Orang Asli[J]. Bulletin of the Indo-Pacific Prehistory Association, 1991, 11: 363-372.
[40] Brumm A, Bulbeck D, Hakim B, Burhan B, Oktaviana A A, Sumantri I, Zhao J X, Aubert M, Sardi R, McGahan D, Saiful A M, Adhityatama S, Kaifu Y. Skeletal Remains of a Pleistocene Modern Human (Homo sapiens) from Sulawesi[J]. PLoS One, 2021, 16(9): e0257273.
[41] Nguyen K S. Hoa Binh Culture in Vietnam after Nearly A Century since Its Discovery[J]. Vietnam Social Sciences, 2021, 202(2): 26-43.
[42] Kandyba A V, Nguyen K S, Chekha A M, et al. Diem Cave: A Stratified Late Pleistocene and Early Holocene Site in Northern Vietnam[J]. Archaeology, Ethnology & Anthropology of Eurasia, 2023, 51(3): 130-139.
[43] Ji X P, Kuman K, Clarke R J, et al. The oldest Hoabinhian technocomplex in Asia (43.5 ka) at Xiaodong rockshelter, Yunnan Province, southwest China[J]. Quaternary International, 2016, 400: 166-174.
[44] Stimpson C M, Wilshaw A, Utting B, et al. TBH1: 12 000‑year‑old human skeleton and projectile point shed light on demographics and mortality in Terminal Pleistocene Southeast Asia[J]. Proceedings of the Royal Society B: Biological Sciences, 2025, 292(2032): 20251819.
[45] Kampuansai J, Wongkomonched R, Kutanan W, et al. Genetic diversity and ancestry of the Khmuic‑speaking ethnic groups in Thailand: a genome‑wide perspective[J]. Scientific Reports, 2023, 13: 14975.
[46] Kutanan W, Kampuansai J, Changmai P, et al. Contrasting maternal and paternal genetic variation of hunter-gatherer groups in Thailand[J]. Scientific Reports, 2018, 8(1): 1536.
[47] Sun J, Wei L H, Wang L X, et al. Paternal gene pool of Malays in Southeast Asia and its applications for the early expansion of Austronesians[J]. American Journal of Human Biology, 2020, 33(3): e23486.
[48] Yap W S, Cengnata A, Saw W Y, et al. High‑coverage whole‑genome sequencing of a Jakun individual from the “Orang Asli” Proto‑Malay subtribe from Peninsular Malaysia[J]. Human Genome Variation, 2025, 12(1): 4.
[49] Hatin W I, Nur-Shafawati A R, Etemad A, et al. A genome wide pattern of population structure and admixture in peninsular Malaysia Malays[J]. The HUGO Journal, 2014, 8(1): 5.
[50] Nagle N, Ballantyne K N, van Oven M, et al. Antiquity and Diversity of Aboriginal Australian Y-Chromosomes[J]. American Journal of Physical Anthropology, 2016, 159(3): 367-381.
[51] Mona S, Tommaseo-Ponzetta M, Brauer S, et al. Patterns of Y-Chromosome Diversity Intersect with the Trans-New Guinea Hypothesis[J]. Molecular Biology and Evolution, 2007, 24(11): 2546-2555.
[52] Karafet T M, Mendez F L, Sudoyo H, et al. Improved phylogenetic resolution and rapid diversification of Y-chromosome haplogroup K-M526 in Southeast Asia[J]. European Journal of Human Genetics, 2015, 23(3): 369-373.
[53] Karafet T M, Hallmark B, Cox M P, et al. Major East–West Division Underlies Y Chromosome Stratification across Indonesia[J]. Molecular Biology and Evolution, 2010, 27(8): 1833-1844.
[54] Nagle N, Ballantyne K N, van Oven M, et al. Mitochondrial DNA diversity of present-day Aboriginal Australians and implications for human evolution in Oceania[J]. Journal of Human Genetics, 2017, 62(3): 343-353.
[55] Pedro N, Brucato N, Fernandes V, et al. Papuan mitochondrial genomes and the settlement of Sahul[J]. Journal of Human Genetics, 2020, 65(10): 875-887.
[56] Gandini F, Almeida M, Foody M G B, et al. Genomic evidence supports the “long chronology” for the peopling of Sahul[J]. Science Advances, 2025, 11(47): eady9493.
[57] Carlhoff S, Duli A, Nägele K, et al. Genome of a Middle Holocene Hunter-Gatherer from Wallacea[J]. Nature, 2021, 596(7873): 543-547.
[58] Hung H C. The formation and dispersal of early Austronesian-speaking populations: new evidence from Taiwan, the Philippines, and the Marianas of western Micronesia[M]//Austronesian Diaspora: A New Perspective. Yogyakarta: Gadjah Mada University Press, 2016: 35-56.
[59] Larena M, Sanchez-Quinto F, Sjödin P, et al. Multiple migrations to the Philippines during the last 50,000 years[J]. Proceedings of the National Academy of Sciences, 2021, 118(26): e2026132118.
[60] Larena M, Sanchez-Quinto F, Sjödin P, et al. Multiple migrations to the Philippines during the last 50,000 years[J]. Proceedings of the National Academy of Sciences, 2021, 118(26): e2026132118.
[61] Hung H C, Matsumura H, Nguyen L C, et al. Negritos in Taiwan and the wider prehistory of Southeast Asia: new discovery from the Xiaoma Caves[J]. World Archaeology, 2022, 54(2): 207-228.
[62] Wang T Y, Wang W, Xie G M, et al. Human population history at the crossroads of East and Southeast Asia since 11,000 years ago[J]. Cell, 2021, 184(14): 3829-3841.e21.
[63] 吴秀杰,范雪春,李史明,等。福建漳平奇和洞发现的新石器时代早期人类头骨 [J]. 人类学学报,2014, 33 (4): 448-459.
[64] 方园,范雪春,李史明。福建漳平奇和洞新石器时代早期人类身体大小 [J]. 人类学学报,2015,34 (02):202-215.
[65] He G L, Sun Y T, Duan S H, et al. Ancient genomes give insight into 160,000 years of East Asian population dynamics and biological adaptation[J]. Genome Biology, 2025, 26(1): 420.
[66] Yang M A, Fan X C, Sun B, et al. Ancient DNA indicates human population shifts and admixture in northern and southern China[J]. Science, 2020, 369(6501): 282-288.
[67] Wang T Y, Wang W, Xie G M, et al. Human population history at the crossroads of East and Southeast Asia since 11,000 years ago[J]. Cell, 2021, 184(14): 3829-3841.e21.
[68] Zhang X M, Ji X P, Li C M, et al. A Late Pleistocene human genome from Southwest China[J]. Current Biology, 2022, 32(14): 3095-3109.
[69] Bai F, Zhang X L, Ji X P, et al. Paleolithic genetic link between Southern China and Mainland Southeast Asia revealed by ancient mitochondrial genomes[J]. Journal of Human Genetics, 2020, 65(8): 1125-1128.
[70] Wei X Y, Zhang M, Min R, et al. Neolithic to Bronze Age human maternal genetic history in Yunnan, China[J]. Journal of Genetics and Genomics, 2025, 52(4): 483-493.
[71] Ran J K, Liu Y C, Wangdue S, et al. Ancient genomes reveal Basal Asian ancestries and dynamic population interactions over time on the southern Tibetan Plateau[J]. iScience, 2025, 28(10): 113676.
[72] Wang T Y, Qiao S Y, Chen Z H, et al. Prehistoric genomes from Yunnan reveal ancestry related to Tibetans and Austroasiatic speakers[J]. Science, 2025, 388(6730): eadq9792.
[73] Macholdt E, Arias L, Duong N T, et al. The paternal and maternal genetic history of Vietnamese populations[J]. European Journal of Human Genetics, 2020, 28(5): 636-645.
[74] Xu Y, Wiradnyana K, Zhou H, et al. Reconstructing the west-east genetic division in Indonesia using ancient genomes[J]. iScience, 2026, 29(6):115974.
Mitochondrial‑Diversity Disparities among East‑Asian Populations
The Austronesian B Maternal Lineage Exhibits a Single‑Branch Structure
First, I will present data‑driven counterarguments against the early hypothesis that mainstream East‑Asian R‑rooted maternal haplogroups such as B and F accompanied Austronesian‑speaking populations in a northward migration from Southeast Asia into East Asia. Setting aside the now‑conclusively established fact that Austronesian populations migrated from the Chinese coast toward Southeast Asia, even from the perspective of maternal‑lineage diversity and branching, currently available data cannot provide a reasonable explanation for such a conclusion.
Comparing the maternal lineages of the Sichuan Yi and Austronesian‑speaking populations, the four dominant haplogroups of the former are A, B, D and F, whereas those of the latter are B, E, F and M7. Only B and F are shared between the two groups, and among Austronesian populations the B and F haplogroups, so far as the data indicate, comprise only specific externally introduced branches, exhibiting a single‑branch structure with internal coalescent ages of approximately 6 000 years. By contrast, the B and numerous R9 sub‑branches among the Sichuan Yi are diverse, with internal coalescent ages generally exceeding 10 000 years, reflecting relatively stronger indigenous dominant‑branch characteristics. The distinction between the Sichuan Yi and Taiwanese Indigenous peoples is that the former are located further west.
This is analogous to the case of B4a and B4b maternal haplogroups, which were initially named after Austronesian populations. Subsequent research revealed that Austronesian groups carry only the specific Austronesian sub‑branch downstream of B4a1a, and likewise only the specific Austronesian sub‑branch downstream of B4b1a2. Taiwanese Indigenous peoples possess B4a1a1 and B4a1a21 branches, while on the mainland, particularly in Guangdong and Fujian, relatively high frequencies of other B4a1a sub‑branches distinct from B4a1a1 and B4a1a2 are found. B4a1b is distributed along the southeastern coast of China and in Northeast Asia; B4a1e was detected in the 9 000‑year‑old Dushan individual from Guangxi; and the diversity of B4a* is concentrated in mainland regions. Among Austronesian populations of the Philippines, Indonesian archipelago and other South‑Pacific regions, B4a is restricted to downstream branches of B4a1a1a.
The sister branch of Austronesian B4a1a, namely B4a1, is found in southern China and the Fujian region. The diversity of sister branches of B4a1 is concentrated among various ethnic groups near Sichuan, and B4a4 is also one of the maternal haplogroups shared by Sino‑Tibetan populations. It was simply the extraordinarily successful diffusion of B4a1a among Austronesian‑speaking populations that led early researchers to assume that B4a was primarily distributed among Austronesian groups and had spread northward from Southeast Asia into East Asia, followed by subsequent westward diffusion from the east. However, considering that B4a3, B4a4 and B4a5 have all been detected in Ladakh, that B4a5* is primarily sampled from western Tibeto‑Burman populations, and that Austronesian B4a exhibits limited diversity, the hypothesis that B4a originated on the eastern coast would appear anomalous.
Within the B5 haplogroup, only the Austronesian sub‑branches downstream of B5a2a2 and B5b1c1 exist, and judging from their age and diversity, they were incorporated at a middle‑to‑late stage. The F2 haplogroup has no Austronesian branches; F3 has Austronesian branches only under F3b1; F4 has them only under F4b1. Although F3b1 includes the representative F3b1b3 branch found in Madagascar, the Austronesian branches of F3b1 are highly concentrated among Taiwanese Indigenous peoples in terms of branch diversity. Furthermore, some F3b1* also exist in southeastern mainland China. Considering that many F3b1 lineages, particularly F3b1a, were detected at the Hanben site, while F3b2 and F3b* are primarily distributed in southwestern and southern China (Yunnan, Guizhou and Sichuan), it is evident that the Austronesian branches downstream of F3b1 more closely represent specific branches that migrated eastward.
Following the onset of the Neolithic, B5b2 was among the first B‑rooted maternal branches to migrate eastward along the Yellow River, and it was detected at the Boshan site in Shandong, the earliest known Neolithic culture in the region, dated to 9 000 years ago. By contrast, other B and F/R9 maternal haplogroups in eastern regions did not appear until the late Dawenkou culture, particularly the Longshan culture, 4 000–5 000 years ago. The sister branch of B5b2, B5a1, was likewise among the first B and F/R9 maternal branches to migrate eastward toward central China, participating in the formation of ancient Hmong‑Mien and Austroasiatic populations before further diffusing into Indochina. This explains why B5b is primarily distributed among Sino‑Tibetan populations and why B5a in Yunnan, Guizhou and Sichuan is also found among Tibeto‑Burman groups. While B4a1 took the southern route through Guangdong and Guangxi, B4a4 took the northern route through the Yellow River basin; the fact that both diffused eastward from the west indicates that B4a maternal haplogroups originated in the west, a pattern also reflected in their current branch diversity.
Turning to the B‑lineage diversity in Melanesia, this region is even less likely to represent a place of origin, since its B haplogroups essentially inherit only the specific B4a1a branch introduced by Austronesian populations. When Austronesian populations first arrived in Melanesia and encountered local Papuan groups, the Austronesians, as incoming populations, did not hold an adaptive advantage in the local environment. Although they may have gradually transitioned to patrilineal social structures in more recent times, evidence from 4 500–5 000 years ago indicates that Austronesian societies were still matrilineal at that time, with knowledge, culture and priestly roles controlled by a small number of highly educated women. The ultimate outcome was that prehistoric Austronesians departed from Taiwan approximately 3 300 years ago, rapidly reached Melanesia, and engaged in limited admixture and diffusion with the patrilineal Papuan populations of the New Guinea lowlands and coasts. Integration was achieved through the marriage of Austronesian women into local Papuan communities, thereby forming tribal alliances. In this process, the Austronesians essentially exported maternal lineages unilaterally to the Papuans2.
Subsequently, populations originally speaking Papuan languages gradually shifted to Austronesian languages under matrilineal influence. Various studies have demonstrated that among Melanesian populations speaking Austronesian languages, language was transmitted through Austronesian maternal lineages, that is, the Austronesians ultimately introduced a Proto‑Oceanic language that influenced local non‑Austronesian inhabitants to abandon their indigenous languages. However, the paternal influence of the original Melanesians exceeded their maternal influence, whereas the opposite held for the Austronesians 3. Among modern Melanesian populations speaking Austronesian languages, O‑M110 and O‑M324 are of Austronesian origin, while C‑M38, C‑M208, M‑P34, K‑M9, K‑P79, K‑M254 and K‑M226 are of original Melanesian origin. This pattern of external maternal lineages transforming local culture and technology is not exclusive to Austronesian populations. As noted by Professor Xie Guoxian (谢国先), prehistoric Tibeto‑Burman populations in southwestern China widely preserve myths of celestial maidens disseminating grain seeds, indicating that the cultural transmission by women is by no means rare, at least from a mythological perspective 4.
Geographic Distribution and Diversity of F Maternal Lineages
Within the F1a’c’f cluster, the downstream sub‑branch F1a* is distributed in western regions, particularly among Sino‑Tibetan populations; the same holds for F3a, F3b*, F4a and F4b*. When investigating origins, one cannot rely solely on the population proportion of specific downstream branches but must instead comprehensively compare diversity across regions. F1c and F1f, which belong to F1a’c’f together with F1a, are maternal haplogroups shared by Sino‑Tibetan populations. F1a1, with a coalescent age of approximately 9 000 years, serves as a signature maternal haplogroup of rice agriculture and spans Sino‑Tibetan, Kra‑Dai, Hmong‑Mien and Austroasiatic populations. Among Austronesian groups, F1a comprises only F1a4a1 (coalescent age ~2 000 years) and F1a1d (coalescent age ~4 000 years), and the branch diversity of F1a is clearly concentrated in mainland China, particularly its southern regions. For the early hypothesis that F maternal haplogroups originated on the southeastern coast or in Southeast Asia and diffused westward from the east, what requires explanation is that only downstream branches such as F1a1d or F1a4a participated among Austronesian F lineages. Moreover, F1a1 includes not only northern branches but also F1a1c, which is widespread across western ethnic groups. By contrast, the population scale of the southeastern coast and Austronesian regions is supported primarily by a single branch, F1a1d, indirectly indicating that the initial diffusion source of F1a1 did not lie toward the southeastern coast but further west, perhaps in the Hunan region.
The F haplogroup was initially named after Indochinese populations. Subsequently, on the basis of the former F1’2 classification, other branches of the R9 maternal haplogroup were redesignated as new F3 and F4 branches. Compared with F3 and F4, F1 and F2 are more closely related. Judging from population distribution, F2 clearly diffused later than F1, and from its first appearance it constituted a Sino‑Tibetan shared maternal haplogroup. Excluding later ethnic reclassification among Sino‑Tibetan populations, F2 bears no relationship whatsoever to Austronesian, Austroasiatic or Tungusic populations; it occurs only at low frequencies among Hmong‑Mien and Kra‑Dai groups, yet is widely distributed across Sino‑Tibetan populations.
F2 is found among the Ladakh Tibetans of Kashmir, the Tanka people of Fujian, and the Scythians, but its frequency among Hmong‑Mien and Kra‑Dai populations is very low and it did not participate in the southward migration into Indochina, while no F2 branches are distributed among Austronesian or Austroasiatic populations. This indirectly indicates that F2 diffused relatively late and clearly spread outward from Sino‑Tibetan populations. Numerous minor F2 sub‑types, including F2a, F2b, F2g, F2e, F2f, F2h and F2i, still exist in the northwestern Qinghai‑Tibet Plateau. Although the diffusion of F2 on the Plateau is less extensive than that of F1c and F1d, possibly due to initial differences in population base, this does not undermine the conclusion that F2 originated at the northeastern corner of the Qinghai‑Tibet Plateau and subsequently diffused along the crescent‑shaped belt toward both north and south, as well as east and west. Because by the time of its southeastward diffusion, Austronesian and Austroasiatic populations had already departed the mainland, F2 did not participate in their formation, indirectly confirming that its origin was not in the southeast and its diffusion occurred relatively late.
Within the F3 haplogroup, only F3a1 and downstream branches of F3b1 (coalescent age ~6 000 years) achieved population growth among Austronesian branches, while F3* is distributed at low frequencies primarily in the western regions of Yunnan, Guizhou and Sichuan. The situation of F3 closely resembles that of F4: apart from Austronesian branches, other F4a1* sub‑branches are also primarily distributed in western regions, whereas F3a1 at least spread to various regions. Furthermore, the Austronesian maternal haplogroup F3b1a’b, which diverged approximately 8 000 years ago, has sister branches F3b1* and the upstream sister branch F3b* that are simultaneously widely distributed among southwestern Chinese Tibeto‑Burman populations such as the Yi, or among minority Kra‑Dai groups such as the Sui. Other sister branches of F1a4, F3b1 and F4b1 are also distributed in Guangdong, Fujian and elsewhere, although only certain individual branches participated in the formation of Austronesian populations. F3b, formerly designated R9a, appears among the Bai of Yunnan and is distributed at low frequencies across southern and western China.
Consequently, the branch diversity of F3 and F4 is concentrated in western China, as is similarly the case for R9b and R9c maternal haplogroups. R9b and R9c clearly did not diffuse from Southeast Asia into East Asia: across the entire western region, both Han Chinese and Tibeto‑Burman populations generally carry small proportions of upstream, minimally differentiated R9b and R9c maternal haplogroups. For instance, among the Bouyei of Guizhou, who preserve more authentic early Kra‑Dai differentiated customs, including language, than the Guangxi Zhuang, some studies have found that non‑F R9 maternal haplogroups not only account for a high proportion but also include many as‑yet‑unnamed branches.
It is simply that the Austronesian branches and their sister branches experienced massive population growth, while the corresponding portion among western Tibeto‑Burman populations never achieved comparable growth, such that they are absent in small‑sample screening and appear only at low frequencies even in large‑sample screening. Examining the branching patterns of individual maternal haplogroups more closely: within B4b’d’e’j, the population proportions of B4e and B4j in China are negligible; among B4d, apart from B4d1, which accounts for nearly 0.5 % of the Chinese population, other branches essentially lack population scale. Similarly, F1d and F1c1a, shared by Sino‑Tibetan populations, began to separate from the Proto‑Sino‑Tibetan ancestral population only with the eastward expansion of the Yangshao culture 5 000 years ago, when Sinitic populations expanded eastward into North China. F1b1, F1d and F1c1a together account for approximately 2.5 %, and adding F3a1, which likewise diffused as late as 4 000–5 000 years ago, these four F branches total approximately 3 %. Excluding these six branches, the proportion of F maternal haplogroups plummets from approximately 15 % to less than 6 %. Therefore, the population diffusion of F/R9 and B maternal haplogroups in East Asia involved only a dozen or so branches that achieved extraordinary population growth during the Neolithic, while the majority of minor branches remained in western regions. The undiffused branches of B4, B5, B6 and R11 maternal haplogroups are likewise concentrated, in terms of branch diversity, in the non‑Plateau regions of southwestern China.
In terms of population frequency, F maternal haplogroups typically account for approximately 16.5 % among Han Chinese, with sub‑branches F1a1 at 3.5 %, F1d at 0.5 %, F1c at 0.85 %, F1g at 0.8 % and F2a at 2.5 %. Only individual branches of F3 and F4 underwent large‑scale diffusion as late as the Neolithic. F1 represents a type that diffused simultaneously across north and south during the Neolithic, whereas F2 diffused much later, coinciding with the formation of southern Han autosomal ancestry. F2a rapidly expanded along the southeastern coast of China over the past 5 000 years, becoming the second‑largest F maternal branch after F1a1. Moreover, only F2a became a nationwide maternal haplogroup, while its other sister branches are primarily distributed in western regions and are rare outside Sino‑Tibetan populations. F3 and F4 diffused southeastward earlier but, as external lineages, did not undergo large‑scale expansion. The diffusion of F1 directly restructured the maternal lineage composition of both northern and southern populations; because F2 diffused later than F1, only F2a achieved a substantial population size.
Having excluded the possibility of a northward migration from Southeast Asia, the prehistoric F maternal haplogroups of Siberia are essentially concentrated among the priestly class and, according to ancient‑DNA evidence, consist primarily of F1b1. Other maternal haplogroups observed include B4d1, F1b1 and F1d, and both their sister branches and upstream diversity are found among Tibeto‑Burman populations. The F1b branches among Mongolic and Manchu‑Tungusic populations are single‑structured and predominantly downstream sub‑branches of F1b1, meaning that other minor sister branches of F1b1, such as F1b1*, must be sought among northern Tibeto‑Burman populations, particularly northern Han Chinese in the Shaanxi‑Gansu‑Sichuan region. This pattern likewise appears among the previously mentioned Austronesian and Austroasiatic populations, whose B, F/R9 maternal haplogroups all represent specific downstream branches.
Including the F maternal haplogroups that flowed into Japan from Siberia, only F1b1a, which expanded in Japan over the past 2 000 years, is present. Ancient‑DNA evidence from Japan shows that prior to the diffusion of F1b1a, apart from some F branches introduced during the later Kofun period and by Chinese immigrants, these lineages essentially served to dilute the population‑scale F1b1a maternal haplogroup in Japan, in marked contrast to the branch diversity of F maternal haplogroups in China. The reason is that although F is a western maternal haplogroup, it remained in the western north for a long time after arriving in East Asia, which explains why F2a was detected among Scythians, and F1f and F1g among Scythian descendant populations. The absence of M71, M74, M75, or M7, M9, M12 is due to differences in their initial positions prior to diffusion.
Having further excluded the possibility of a southward migration from Siberia into East Asia, consider the early Tibeto‑Burman populations at the initial stage of Sino‑Tibetan divergence. Taking the currently available ancient‑DNA samples of the Qijia culture, composed of O‑M134 plus a small proportion of D‑Z27269 paternal lineages, as an example, their maternal composition features high frequencies of A, B and F haplogroups. At the Lajia site of the Qijia culture, among the currently known total of 21 maternal samples, within the NR cluster there are 6 A samples, 4 B samples and 4 F samples, plus one R11a downstream of R11’B6, collectively accounting for approximately 70 %. Within the M cluster, there are 3 G samples, one M10a1 sample, one M11a sample and one D4h1b sample5, which exceeds the total proportion of A, B and F maternal haplogroups among modern Han Chinese.
Furthermore, the B4c1b2c2 maternal haplogroup detected in sample LJM25 also appears among the Swiss, descendants of Western Slavs who accompanied the diffusion of ancient Scythians, as well as in the early southward expansion of the Yangshao culture or the Longshan culture of the middle and lower Yellow River, and later appeared among Austroasiatic populations in Vietnam and Thailand. The upstream sister branch of B4c1b2c2, B4c1a, was detected at the Taohuamusite site in Northeast China dated to approximately 10 000 years ago, and subsequently distributed across Japan, Korea and Siberia, as well as northwestern and southwestern China. B4c1b2c2 is also a non‑Austronesian branch and was detected among the Ladakh Tibetans as a predominantly Sino‑Tibetan maternal haplogroup.
B4c1b2a2, which shares a more recent common ancestor with B4c1b2c2, is a maternal branch of southern Han Chinese and Austronesian populations. The B4c2 maternal haplogroup, early identified as primarily distributed in Indochina, has in recent years been found across all ethnic groups of Yunnan, with Indochina representing merely an extension of Yunnan’s diffusion. A reasonable explanation for these data is that the B4c maternal haplogroup originated in some region of western China; when B4c2 migrated directly southward, the relatively later southward‑migrating B4c1 included both B4c1a and B4c1c, which migrated primarily northward, and B4c1b, which migrated primarily southeastward. The latter includes B4c1b2a2, which migrated southward earlier, then eastward, and simultaneously participated in the formation of both southern Han Chinese and Austronesian populations, as well as B4c1b2c2, which migrated southward later, with some individuals even migrating northwestward, and maintains a presence among both northern and southern ethnic groups.
Distribution and Diversity of Maternal Lineage Structure among Tibetan Populations
A distinctive feature of Tibetan maternal lineages is the near‑absence of N9a, which is primarily distributed in eastern regions. The frequency of B maternal haplogroups across various regions of Tibet also remains below 5 %, whereas the frequencies of A and F haplogroups, as well as more recently incorporated West Eurasian maternal lineages, all exceed the Han Chinese average. For instance, apart from the Ngari region, where F generally fails to reach 10 %, other areas exhibit F frequencies of approximately 15 %, with some localities reaching even higher levels: Tingri in Xigazê at approximately 27.27 %, Dêngqên in Qamdo at approximately 24.19 %, and Bomi County in Nyingchi at approximately 24 %, all clustering around an average frequency of 25 %6, while many other localities hover around 20 %. Sampling of A maternal haplogroups across Tibetan regions likewise generally falls within the 10–20 % range, meaning that the frequency of A in Tibet is nearly twice the Han Chinese average. However, Tibetans almost entirely lack F3, F4, R9b and R9c, which are commonly detected among Yunnan Tibeto‑Burman populations, whereas F1 and F2 encompass numerous sub‑branches with internal coalescent ages approaching 10 000 years7. Further toward the periphery, Nepalese F1 includes F1c, F1d1 and F1g, while F2 includes F2b8.
The largest source of Tibetan maternal lineages derives from the Yangshao culture, which migrated along the upper Yellow River onto the Qinghai‑Tibet Plateau. This includes B4d1, the highest‑frequency B4 sub‑clade on the Plateau, and F1d, the highest‑frequency F sub‑clade, both of which appear simultaneously at the Wanggou site in Henan dating to the Yangshao period. The sister branches of the Tibetan ADF maternal cluster are also primarily distributed in Gansu, Qinghai and surrounding regions. The Qijia culture represents an early‑diverging Tibeto‑Burman population that did not ascend onto the Plateau; as previously noted, its dominant maternal haplogroups are A, B, D and F, which do not include M9, currently one of the four major maternal haplogroups among Tibetans. Furthermore, both the Qijia culture and non‑Plateau Tibeto‑Burman populations of southwestern China exhibit relatively high frequencies of B maternal haplogroups, indicating that B lineages participated minimally in the formation of Plateau Tibetans, whereas M9 underwent massive expansion. The presence of F1b, F1c1a, F1d, F2 and B4d on the Qinghai‑Tibet Plateau is readily explained by migration from the Majiayao–Qijia cultural complex onto the Plateau. At the same time, M13a and M62b on the Plateau are distributed among Austroasiatic populations.
Consequently, the maternal distinction between Tibetans and other Tibeto‑Burman populations is that the former are dominated by A, D, F and M9 as their top four haplogroups, whereas the latter are dominated by A, B, D and F. Tibetans carry an average of approximately 25 % M9 maternal haplogroups, concentrated in M9a1a1c1b with a coalescent age of approximately 5 000 years, while the average frequency of M9 across China is only about 1 %. The sister branch of M9a, M9b, is not concentrated among Tibetan populations at all but is instead distributed among non‑Tibetan populations of southern and southwestern China and Indochina. Within the M9 downstream cluster M9a’b and E, the E2 sub‑clade E2a is distributed across the Indonesian archipelago, eastern Malaysia and the Philippines, while E2b is found in Taiwan9. Within E1, E1a1 is distributed in Taiwan, E1a2 and E1b across the Indonesian archipelago and eastern Malaysia, M9b1 in Zhejiang, and M9b2 in Vietnam, Indochina.
Noteworthy are the Baima people, a population speaking a Tibetan dialect who inhabit southeastern Gansu. They carry paternal D‑P47 and D‑F729 at frequencies exceeding 60 %, resembling the paternal structure of Tibetans. The maternal similarity between Baima and Tibetans lies in their shared high frequencies of A, D and F haplogroups; the difference is that M9a1a1c1b, the largest maternal haplogroup among Tibetans, occurs at low frequency among the Baima10, while H6a1b of Scythian origin accounts for 5 %. Judging from currently available ancient‑DNA data for Tibetan M9a1a1c1b, this lineage is primarily concentrated in O2a2b1a1a1a4a1‑CTS5308, a western Tibeto‑Burman characteristic sub‑branch of O‑M134 with a similar coalescent age of approximately 5 000 years. In terms of the regional frequency distribution of M9 across Tibet, the highest‑frequency locality is Jiangzi County in Xigazê at approximately 40 %. The average M9 frequencies across Tibetan regions are approximately: Ngari 26 %, Qamdo 13 %, Lhasa 23 %, Nyingchi 12 %, Nagqu 16 %, Xigazê 30 %, and Shannan 25 %, with Qamdo, Nyingchi and Nagqu showing markedly lower frequencies than the other regions.
References
[1] Trejaut J A, Kivisild T, Loo J H, et al. Traces of Archaic Mitochondrial Lineages Persist in Austronesian-Speaking Formosan Populations[J]. PLoS Biology, 2005, 3(8): e247.
[2] Jordan F M, Gray R D, Greenhill S J, et al. Matrilocal residence is ancestral in Austronesian societies[J]. Proceedings of the Royal Society B: Biological Sciences, 2009, 276(1664): 1-9.
[3] Kayser M, Choi Y, van Oven M, et al. The Impact of the Austronesian Expansion: Evidence from mtDNA and Y Chromosome Diversity in the Admiralty Islands of Melanesia[J]. Molecular Biology and Evolution, 2008, 25(7): 1362-1374.
[4] 谢国先。论中国少数民族谷种起源神话 [J]. 民族文学研究,2006 (4): 17-23.
[5] Li C X, Li J, Cui Y Q, et al. Ancient Mitochondrial Genomes Reveal the Maternal Diversity and Genetic Influence of the Qijia Culture in Prehistoric Eastern Asia[J]. _Journal of Genetics and Genomics_, 2026, 53(1): 45–54.
[6] Qi X B, Cui C Y, Peng Y, et al. Genetic Evidence of Paleolithic Colonization and Neolithic Expansion of Modern Humans on the Tibetan Plateau[J]. Molecular Biology and Evolution, 2013, 30(8): 1761-1778.
[7] Li X, Zhang X P, Yu T, et al. Whole mitochondrial genome analysis in highland Tibetans: further matrilineal genetic structure exploration[J]. Frontiers in Genetics, 2023, 14: 1221388.
[8] Basnet R, Rai N, Tamang R, et al. The matrilineal ancestry of Nepali populations[J]. Human Genetics, 2022, 141(12): 1823–1838.
[9] Soares P, Trejaut J A, Loo J H, et al. Climate Change and Postglacial Human Dispersals in Southeast Asia[J]. Molecular Biology and Evolution, 2008, 25(6): 1209–1218.
[10] 毛乙臻,王飞,刘雨佳,等。线粒体 DNA 基因组揭示的白马人群的遗传结构 [J]. 中国科学:生命科学,2025, 55 (1): 153-167.
Population‑Genetic Structures of Japan, the Americas and South Asia
Okinawan Shimotabaru People and Jōmon Maternal Lineages
The earliest ancient‑DNA data from Japan currently available all originate from the Shiraho Saonetabaru Cave site on the east coast of Ishigaki Island, Okinawa. Among the partially genotyped samples, one carries B4e, a haplogroup dated to approximately 25 000 years ago, still found at low frequency (~0.5 %) in present‑day Okinawa, and belonging, together with B4b (which includes the Native American B2 lineage), to the B4b’d’e’j cluster. A second sample carries an as‑yet‑unresolved R*, while the remaining three samples are M7a1, a haplogroup that later achieved high frequency among Jōmon populations. Precisely because B4e was first detected in Okinawa, both B4e and the later‑detected B4f were initially named after Japan. Nevertheless, currently available maternal lineages from the later Jōmon period are concentrated within M7a and N9b.
Accordingly, the ancient‑DNA profile of Japanese maternal lineages is first characterised by geographic remoteness, which resulted in a scarcity of minor M and N sub‑branches. The subsequent Jōmon period is almost exclusively restricted to M7a and N9b, whereas earlier Japanese data reveal traces of minor and as‑yet unresolved R maternal lineages. If one considers Japan‑specific maternal branches with substantial antiquity, meaning coalescent ages approaching 10 000 years or more, Japan is limited to B4e, M7a, N9b, and that single unresolved R* sample. If one further notes that M7a spans both Japan and Korea while N9b does not (Korea carries 1–4 % M7a but nearly 0 % N9b), then the currently resolved, Japan‑specific maternal branches are restricted to B4e2 and N9b.
By contrast, D4, the highest‑frequency maternal haplogroup in modern Japan, including D4a, D4b, D4c, D4e and D4g, exhibits internal coalescent ages generally not exceeding 9 000 years, far younger than those of Japanese M7a and N9b. Moreover, judging from the limited ancient‑DNA data currently available, early Japanese D4 samples, such as the D4h1a2 female designated D1604 from the middle Yayoi period at the Doigahama site2, are genetically closer to modern Koreans than to modern Japanese. Consequently, D4, a high‑frequency haplogroup for which Japan lacks deep ancient‑DNA evidence, arrived from the Korean Peninsula in relatively recent times, at least recent relative to M7a and N9b, and underwent rapid expansion, having not been an indigenous maternal lineage of the Japanese archipelago prior to that arrival.
Second, comparing the upstream and downstream branch distributions of the dominant ancient‑DNA maternal haplogroups M7a and N9b in Japan, the upstream sister branches of both are widely distributed across eastern China, approximating the range of the prehistoric Three‑Seas Plain. However, their downstream sister branches differ markedly. The branch diversity of M7a is concentrated not only in Japan and Korea but also widely distributed across Asia, whereas the downstream branches of N9b are, so far as current data indicate, restricted to Japan. For example, the closest sister branch of M7a, M7b’c, includes downstream M7b sub‑branches: apart from M7b1a1a1, which is distributed in Japan and Korea, the remaining sister branches, including M7b1a1a2‑7 and M7b1a1b, are distributed in Indochina. M7b1a2 is found among Taiwanese Indigenous peoples and other Austronesian populations, while M7b1a and one M7b* sample were detected at the Daxie Island site in Ningbo within the Liangzhu cultural sphere3. M7b1a is also distributed at high frequency among the Dai (a Kra‑Dai people of Yunnan), the Yao of Guangxi (a Hmong‑Mien people), the Amis (an Austronesian people), and across southern China. M7b1b is distributed in Central Asia and Siberia, while M7b2 and M7b3 occur in Indochina. Within the other downstream branch of M7b’c, M7c, the sub‑branches M7c1, M7c2 and M7c3 are primarily distributed among Austronesian populations, and along the southeastern coast, for instance, the Tanka people, dominated by paternal O1a1‑M119 and O1b1‑M95, exhibit high frequencies of M7b and M7c maternally4.
By contrast, all downstream branches of N9b are distributed exclusively in Japan, and the geographic distribution of N9b in Japan, both ancient and modern, is skewed toward the east, occurring almost exclusively in eastern and northeastern Honshu and Hokkaido. Archaeological evidence likewise reveals a distinction: eastern Japan, from Hokkaido to north of central Honshu, predominantly employed longitudinal blade‑detachment microlithic technology, whereas western Japan more frequently employed transverse blade‑detachment technology resembling that of North China and the southeastern coast. Consequently, the distributional difference between N9b and M7a in Japan is that N9b, including ancient samples, predominates in eastern and northeastern regions, while M7a, although found at both eastern and western ancient sites, exhibits a western‑skewed distribution according to available studies5. Considering further that Jōmon ancestry is proportionally higher in the Kantō and Tōhoku regions of Honshu and lower in Shikoku and Kinki6, N9b aligns more closely with the geographic distribution of this component than does M7a.
The most reasonable explanation for the geographic distribution of the Japanese M7 sub‑branch M7a is that when prehistoric paternal O1‑F265 entered East Asia, the Last Glacial Maximum caused O1b‑M268 to split: while O1b2‑P49 migrated eastward, O1b1‑F2320 and O1a‑M119 migrated southward along the eastern coast. This directly caused the M7 maternal cluster to diverge into M7a (Japan‑Korea) and M7b’c (southern China). This interpretation is also consistent with the estimated divergence time of O1b2‑P49 at approximately 28 000 years ago and the estimated origin time of M7a at approximately 26 000 years ago, the two are chronologically close. Recent studies have frequently detected components related to present‑day Austronesian populations and to coastal populations of southern East Asia among Japanese Jōmon individuals7, which should relate to the component originally introduced by the M7a maternal lineage.
N9b, the other major ancient‑DNA maternal haplogroup alongside M7a, exhibits an East Asian distribution and branch‑diversity centre skewed toward the east when viewed across East Asia as a whole. It may have originated prehistorically in the Three‑Seas Plain region, which subsequently became an important factor driving the cross‑island divergent isolation of N9a, Y and N9b. In retrospect, N9b is restricted to Japan, while its sister branches N9a and Y are widely distributed across eastern China, the Korean Peninsula and Northeast Asia; the downstream sub‑branch N9a6 is primarily distributed in Indochina. Ancient‑DNA evidence reveals that N9a8 and N9a9, which later migrated westward into eastern Europe at an early stage, represent merely a minor spillover of N9 from eastern East Asia. More importantly, the high frequency of Y2a1 (coalescent age ~2 500 years) among southern Austronesian populations in Asia cannot be cited as evidence that N9 expanded from south to north.
Sister branches of Y2a include Y2b and Y2d, which did not migrate southward toward Japan and Korea at that time, and Y2e, which diffused toward Siberia. Unlike the Y2 maternal cluster, whose pre‑expansion homeland may have been in the Ordos Loop region before diffusing northeastward toward Japan and Korea and southeastward, the subsequent diffusion of Y1 was primarily directed toward the crescent‑shaped belt. Although Y2a1, a downstream branch of Y2, is distributed among southern Austronesian populations, other sister branches of Y2a occur across East Asia: Y2* is primarily distributed among Han Chinese, Y2a* across southeastern coastal provinces of China and Taiwan, Y2b, Y2c, Y2d, Y2e and Y2f across China, Japan and Korea, while Y2a1 (coalescent age 2 500 years) is entirely distributed in the Philippines, Indonesia and other Southeast Asian regions. Y2a2 is found in Taiwan and Y2a3 in Brunei. Furthermore, in a prior study of samples LMCM1 and LMCM2 from the Hanben site in Taiwan, the authors likewise concluded that Y2a1 accompanied Austronesian populations from the southeastern coast into the Indonesian archipelago, rather than the reverse8.
Prehistoric Japanese Lithic Technology and Culture
Japanese lithic technology during the Palaeolithic consistently belonged to the same technological tier as North and Northwest China, comprehensively surpassing other regions of the Far East, here referring primarily to South China, Indochina, the Indonesian archipelago, the Philippine archipelago, and Australasia east of Wallace’s Line. Furthermore, the Jōmon people of Japan’s Jōmon period possessed a complete polished‑microlithic technological repertoire from their earliest historical appearance. At Tanegashima in the northern Ryukyus, for instance, late‑Palaeolithic archaeological deposits have yielded edge‑ground axes, flake tools, trapezoidal implements, grinding stones and boiling stones, as well as clusters of fire‑cracked pebbles with charcoal and hunting traps. The microblades recovered there resemble those found in Kyushu on the Japanese mainland, which is unsurprising given their proximity and the likelihood that the islands were once connected. By contrast, Southeast Asia and South China had not yet developed microlithic technology even at the onset of the Neolithic.
Beyond the production of projectile points, microlithic technology also yielded craft goods and ornaments for trade networks, as well as various domestic implements. Bone needles, for example, could be used to sew clothing and fashion hairpins, or serve as tools for scraping meat and extracting marrow. Grinding stones allowed seeds and other foods to be milled into finer particles, reducing the demand on masticatory muscles; as these muscles atrophied, the need to maintain flared cheekbones diminished. Most notably, microlithic technology enabled the manufacture of cooking vessels such as pots for boiling soups. Jōmon sites yield traces of pottery from their earliest appearance, together with an incipient pot‑boiling subsistence system. Pottery sherds dated to 16 000 years ago have been found not only in Honshu but also in Okinawa, at the Shimobaru Cave site. Apart from storage, the primary function of pottery was cooking. If projectile points represent the early phase of the microlithic era, then pottery represents its late phase.
Additionally, current academic research confirms that incipient agriculture existed during the Jōmon period: the Jōmon people were not pure hunter‑gatherers. At the Sannai‑Maruyama site in Aomori Prefecture, northern Japan, for example, evidence indicates that the Jōmon people had previously deliberately cultivated crops including Castanea crenata, Juglans mandshurica, Glycine max and Vigna angularis9. This differs, of course, from the complete rice‑farming agricultural technology later introduced by the Yayoi migrants from the Korean Peninsula; the former represents only incipient, preliminary agriculture, whereas the latter constitutes fully developed late‑stage agriculture.
A common misconception requiring clarification is that the Yayoi population, which migrated to Japan from the Korean Peninsula in relatively recent historical times, is now shown by research to share similar genetic components with the indigenous Jōmon people. More precisely, male individuals currently excavated from Yayoi‑period contexts in Honshu generally carry high Jōmon ancestry, even higher than that found in the present‑day Ryukyu Islands. Studied ancient Yayoi individuals can be modelled as approximately 50 % Jōmon ancestry and 50 % Northeast‑Asian‑related ancestry 10. It was the subsequent influx during the Kofun period of populations carrying substantial ancestry related to the Yellow River basin of East Asia that ultimately formed the modern Japanese. This means that the Yayoi people themselves constituted a recently admixed population, simply understood as a binary mixture of Jōmon‑ancestry populations and prehistoric Northeast‑Asian‑related populations, and their Jōmon component was far higher than the approximately 10 % Jōmon ancestry found in modern Japanese.
Second, the Yayoi people also carried high frequencies of D1a2a1a‑M125, a sister branch of the Jōmon paternal lineage D1a2a1c‑CTS6609, which prehistorically appears to have originated preferentially on the Korean Peninsula. At the Daeseong‑dong burial complex in Gimhae, South Gyeongsang Province, South Korea, the most important elite cemetery of the Gaya period, one individual carrying D1a2a1‑CTS9988 was discovered11, indirectly indicating that the prehistoric distribution of D1a2a‑M55 was not restricted to the Japanese archipelago but also encompassed Sakhalin, Kamchatka, and particularly the southern Korean Peninsula. The formation of the so‑called Yayoi people began as early as the encounter between O1b2‑P49 and the D1a2a‑M55 lineages distributed in the southern Korean Peninsula.
Maternal Lineage Affinities among Native American Populations
As for whether this distribution extended beyond the Kamchatka region, the academic community has formally rejected since the 1990s the claim that the Clovis Culture represents the earliest trace of human activity in the Americas. Both the Bluefish Caves in Canada’s Yukon Territory, securely dated to 24 000 years ago, and the more recently discovered White Sands footprints in New Mexico, dated to 21 000–23 000 years ago12, predate the traditional Clovis Culture by nearly 10 000 years. Additionally, earlier sites such as Chiquihuite Cave in Mexico, dated to 26 000–33 000 years ago, are temporarily excluded because the recovered stone artefacts cannot be definitively identified as human‑made. Nevertheless, none of these sites appears to be the central focus.
Information more worthy of attention is that the lithic technologies of the various pre‑Clovis cultures currently discovered bear no hereditary relationship to later Native American cultures; each population employed a distinct lithic technological system. At Swan Point in northwestern North America, dated to 14 000 years ago, lithic technological similarities have been identified with Dyuktai Cave in the Aldan River basin of Northeast Asia, dated to approximately 20 000 years ago. These represent the Yubetsu‑technique microblade tradition, centred on wedge‑shaped microblade core technology, which differs from the later Clovis Culture’s emphasis on large projectile weapons. The early Jōmon people of Hokkaido likewise employed this Yubetsu‑technique microblade technology. This body of lithic technology was in fact shared across Northeast Asia, Kamchatka, and the northwestern region of North America.
In the 20th century, Soviet scholars such as Alexey Okladnikov, after examining the advanced Indigenous cultures of North America, arrived at many similar conclusions: namely, that a prehistoric “Jōmon–Kamchatka–Indian” North Pacific cultural community existed, and that the microlithic technology of core North American Indigenous populations shared a common origin with that of the Jōmon people. Broadly stated, an advanced microlithic technology emerged in Northeast Asia before 25 000 years ago, subsequently influencing portions of the Japanese Jōmon, Kamchatka, and further eastward the Bering Strait and northwestern North America. No corroborating ancient‑DNA data have yet been discovered for this population; only indirect lithic technological traces remain. The American regions not affected by this unknown population are, in retrospect, precisely the regions of South America.
Early research suggested that Indigenous South American populations such as the Suruí, Karitiana and the Xavante of the Brazilian Plateau carried small amounts of Australasian ancestry, that is, ancestry related to Indigenous populations of Australia, New Guinea and the former Sahul continent13. Subsequent research found that this component appears not only among Amazonian Indigenous peoples but also among Pacific‑coast populations across South America, indicating that it is a component widely distributed among Indigenous South American populations. By contrast, this component has not been detected in North or Central America, or where detected in certain groups, is extremely weak14. From the perspective of currently available ancient DNA, North America has indeed yielded early human remains with Caucasoid‑like morphological features, such as the Kennewick Man of North America, dated to 8 500 years ago. Initial craniometric assessments by scholars judged his morphology to resemble Polynesian populations, particularly the Ainu of Hokkaido, and to lack definitive Native American characteristics15. Subsequent whole‑genome testing, however, demonstrated a closer relationship with Native Americans; Kennewick Man’s paternal Q‑M3 and maternal X2a are both major lineages of present‑day Native Americans.
Kennewick Man is clearly distinct from the Anzick‑1 boy, who carried paternal Q‑L54 and maternal D4h3a. The latter shares closer affinities with modern Central and South American tribes such as the Awajún, Ayoreo, Guarani, Karitiana, Sirionó, Suruí and Tsimané. He also shares maternal D4h3a with Sumidouro 5, a 9 000‑year‑old individual from South America carrying paternal Q‑M848 and maternal D4h3a, the latter having been confirmed to share affinities with Indigenous Australian populations. D4h3 is in fact another downstream D4 sub‑branch among Native Americans, alongside the D1 maternal haplogroup. The Patagonian peoples of southern South America, for instance, initially comprised a combination of D1, C1 and D4h3a maternal haplogroups16. Approximately 4 000 years ago, B2 maternal lineages began flowing into northern Patagonia, at which point the Patagonian peoples still employed crude microlithic technology. Subsequently, the B2b maternal lineage directly introduced a complete American‑version Neolithic technological package, and over the following 2 000 years it became the highest‑frequency maternal haplogroup while carrying a full Neolithic technological repertoire.
The B2 maternal haplogroup is in fact B4b2, with a coalescent age of approximately 15 000 years; its sister branch B4b1 is distributed in China, particularly the northeast, while B4j, also belonging to the B4b’d’e’j cluster, is now a major maternal haplogroup of Northeast Asia. Moreover, the American population carrying B2 arose almost entirely through explosive growth within the past 6 000 years, with its diversity concentrated in the central‑southern region of North America. The subsequent agricultural diffusion across the Americas was completely synchronised with the diffusion of the B2 maternal haplogroup, which also produced two sharply divergent physical, customary, cultural and technological profiles among Native Americans. For instance, both Indigenous South Americans and Papuan New Guineans practice related systematic cannibalism: complete endocannibalism, in which deceased relatives of one’s own tribe are consumed so that their life‑force returns to the family, and exocannibalism of a war‑revenge nature, in which the flesh is roasted. Native North Americans, by contrast, did not practice systematic cannibalistic ritual; any cannibalism occurred only under conditions of specific famine. Despite all three groups carrying paternal K2b‑P331, descended from F‑M89, the marked differences between them are in fact attributable to differing maternal lineages producing distinct autosomal profiles. Judging from the far more voluminous physical descriptions recorded in 18th–20th‑century sources, Native North and South Americans also exhibit substantial physical differences.
Caste‑Associated Maternal Lineages of Indigenous South Asian Populations
This pattern of populations inhabiting the same region yet exhibiting radically divergent customs and physical appearance is not exclusive to the American continent; the South Asian subcontinent presents an analogous situation. Historically, significant compositional differences have also existed between northwestern and northern India on the one hand, and southern India on the other. The formation of South Asian populations can be simplistically understood as follows: between 7 400 and 5 700 years ago, early Iranian farmers entered South Asia from northwestern India and admixed with local ancient South Asian indigenous populations, forming the Proto‑Dravidian peoples17. This formation occurred during what later became known as the Indus Valley Civilisation period. Subsequently, the Proto‑Dravidian populations that remained in the north admixed with later pastoral nomads from the Central Asian steppe (Central_Steppe_MLBA), forming the Ancient North Indian (ANI) population, while those that migrated southward were less affected by Central Asian nomadic gene‑flow and subsequently admixed further with ancient southern South Asian indigenous populations, forming the Ancient South Indian (ASI) population.
The admixture proportions of different population components are even correlated to some extent with the later Indian caste system, since it is well known that the genetic components and non‑recombining regions of Indian castes are not uniformly distributed. For instance, upper‑caste Brahmins and Kshatriyas carry more Ancient North Indian (ANI) ancestry than lower castes, whereas the Dravidian populations of the southern lower castes are dominated by indigenous Ancient South Indian (ASI) ancestry18. Overall, the proportion of ANI increases continuously toward the northwest, in regions such as Pakistan and Kashmir.
From the perspective of non‑recombining regions, the paternal haplogroup R1a1a1b2‑Z93 accounts for a markedly higher proportion among Brahmins than among other strata of Indian society, and is currently regarded by scholars as the founding paternal lineage of the Brahmins19. Furthermore, West Eurasian maternal haplogroups occur at higher frequencies among high‑caste Indian populations. The most common R‑rooted maternal branches in India, such as U or R5, account for 15 % among caste populations but only 8 % among tribal populations excluded from the caste system20. The diversity of U maternal haplogroups also differs between tribal and caste populations: for example, U2e is entirely absent among tribes, and the frequencies of U1 and U7 are very low, whereas U2e is present among upper castes and its frequency increases with caste rank21. H and T are more common in northern than in southern India, whereas the J maternal haplogroup occurs only among southern Indian populations.
Conversely, M maternal haplogroups reach their highest frequency among tribal populations. The distribution of M in India is skewed toward the south and east, inversely correlated with the distribution of U22. The frequency of M among southern Indian tribal populations ranges from 70–80 %, slightly higher than the 65 % observed among southern Indian caste populations. The Vedda exhibit the lowest M frequency, at only 18 %, while their R frequency, approximately 45 %, predominantly U1a and U7a, is the highest. The R maternal haplogroups of the Sinhalese are primarily R30b, yet all these related populations show some contribution from West Eurasian populations.
Additionally, M maternal haplogroups gradually decrease from south to north across India, while N maternal haplogroups follow the opposite pattern. Dravidian‑speaking populations of eastern and southern India carry high frequencies of M, ranging from 76.32 % among the Nayakpod tribe of southern India to 81.58 % among the Oraon tribe of eastern India23. R30b originated in northern India approximately 44 000 years ago24; R30b1 is largely restricted to northern India, including Punjab, Jammu and Kashmir, Uttar Pradesh and Gujarat. R30a1c1 is confined to a single Kurumba tribe known as the Uru Kurumban in southern India. Within R30, R30a has the widest distribution across South Asia, while R30b2a has been detected among the Vedda of Sri Lanka.
Compared with U maternal haplogroups, R‑rooted lineages that clearly arrived in South Asia from the Near East in late prehistory, there are also R‑rooted lineages that originated in, or arrived very early in, South Asia, such as R6, R7 and R8. The frequency of R7a is concentrated in the Indian states of Bihar, Jharkhand and Chhattisgarh, while R7b peaks in Andhra Pradesh. R7b, the sister branch of R7a, appears largely restricted to Dravidian speakers of southern India rather than northern Indians. The R7 maternal haplogroup occurs at high frequency among Austroasiatic populations, particularly the Kherwari, a North Munda‑speaking group, where it is represented by the downstream sub‑branch R7a1 with a coalescent age of only 3 000–7 000 years. By contrast, R7 is very rare among South Munda populations25, making it unlikely that R7 was introduced by Austroasiatic populations; the best explanation is an indigenous origin or an extremely early migration into South Asia. The R8 maternal haplogroup diverged during the middle‑to‑late Palaeolithic and likewise occurs at high frequency in Odisha, eastern India, with low‑frequency distribution across various Indian regions. Finally, N‑rooted maternal haplogroups with strong South Asian affinity should include N5, R5, R6, R7, R8, R30, R31 and R32, whereas R1, R2’UT, R4, N2, N3 and N6 belong to a broader Near‑Eastern, Iranian and northwestern‑South Asian sphere and therefore exhibit weaker South Asian affinity than the former group.
The diversity of R0a and HV* is clearly centred in the Levant of the Near East, representing R‑rooted branches that did not participate in migrations and remained in the Near‑Eastern homeland; some R0a lineages, together with U6, later retreated into North Africa. The overall diversity centre of the HV maternal cluster shifts further toward Central Asia than R0a* or R0*, which subsequently led to V becoming a branch primarily distributed in Northeastern Europe, and to H becoming the largest maternal haplogroup during the expansion of Indo‑European populations. The numerical dominance of H among West Eurasian maternal lineages is indeed attributable to its co‑expansion with Indo‑European populations.
According to current research, the reference population for Ancient Ancestral South Indian (AASI) comprises certain indigenous southern Indian tribes, such as the Irula, whose paternal pool is composed of high‑frequency F‑M89 and H‑M69, intermediate‑frequency K‑M9 and C‑M130, and low‑frequency P‑M45, R‑M207 and Q‑M24226. Another group, the Paniya, carries high‑frequency F‑M89, a small proportion of C‑M130, and low‑frequency J2a3‑M68 and K‑M927. These two groups can be regarded as the Indian marginal tribal populations that currently best represent AASI, with a negligible proportion of northern Iranian Neolithic ancestry. In addition, the Koraga of the southwestern Indian coast, whose maternal pool is composed of high‑frequency U1a1a, U2a1, M3a2a and M3028, can also be modelled as an admixture of AASI‑like and Iranian‑Neolithic‑related ancestry29.
Populations with similar paternal structures include the Kanikaran, Paliyan, Pulayar, Kadar, Santal, Korwa, Parhaiya, Juang, Kharia, Irular, Paniyan and other Indian marginal tribal indigenous populations whose exact numbers cannot be reliably estimated. Their shared characteristic is a paternal pool dominated by high‑frequency F‑M89 and H‑M69, supplemented by a certain frequency of C‑M130 and K‑M9. I suspect that the K‑M9 cited in these studies refers, apart from K‑M9*, primarily to minor unresolved R1‑M207 and R2‑M479 lineages, which are the most likely candidates for relatively recent external paternal lineages rather than indigenous ones. The general physical characteristics of populations with high AASI ancestry are roughly: dark skin, curly hair, short stature, depressed nasion and depressed nasal bridge, Australoid‑like features. This description applies to the Soliga, whose paternal pool is composed of H1a1‑M52, F‑M89, J2b2‑M241, C1b1‑AM00694, R2a‑M124, L1a‑M76 and Q1‑M24230.
The Vedda and Andaman Islanders, often mistakenly assumed by the general public to represent AASI ancestry, cannot directly serve as AASI proxies. The former have been shown to carry substantial Iranian‑related ancestry, evident even from their maternal lineages, while the latter are in fact a sister branch of the AASI component of the Indian mainland. Comparing the maternal frequencies of the Vedda with those of pure AASI tribes reveals that the Vedda indeed carry far more N than M maternal haplogroups, including R‑rooted lineages such as R30b, R8a1a3, R5a2b, U7a, U2a and U1a’c31, while their M haplogroups include M3c1, M6a, M36a, M36d, M73’79, D4a and G3b1. Comparing the Vedda with other inhabitants of Sri Lanka, such as the Sinhalese, the latter carry more diverse M haplogroups including M2a1, M12a1b, M36a, M45, M52, M33a1b, M35, M65a and M66, and N haplogroups including W, N1a1’2, R30b, R8a1a3, R5a2b, R6a, U1a’c, U7, U7a and P4a32.
Observing the paternal distinction between Andaman Islanders and representative Indian AASI tribes, the key difference is that the former comprise two linguistic groups, the Great Andamanese languages and the Ongan languages, while overall exhibiting a mixed paternal profile of K2b‑P331 and D1a2b‑Y34637. Considering that the Great Andamanese‑language population far outnumbered the Ongan‑language population before the British colonial invasion of the Andaman Islands in the 18th century, even though K2b‑P331 predominates, a proportion of D1a2b‑Y34637 was nevertheless incorporated. By contrast, representative AASI marginal tribes such as the Irula and Paniya of India carry 100 % F‑M89 and possess no downstream branches of D‑M174.
References
[1] Shinoda K, Adachi N. Ancient DNA Analysis of Palaeolithic Ryukyu Islanders[J]. Terra Australis, 2017, 45: 51-59.
[2] Kim J, Mizuno F, Koganebuchi K, et al. Genetic analysis of a Yayoi individual from the Doigahama site provides insights into the origins of immigrants to the Japanese Archipelago[J]. Journal of Human Genetics, 2024, 69(12): 789‑797.
[3] 文少卿,雷少,孙畅,等。浙江宁波大榭遗址一期人骨的古 DNA 研究 [J]. 南方文物,2020 (06): 261-266.
[4] He G L, Zhang Y, Wei L H, et al. The genomic formation of Tanka people, an isolated "Gypsies in water" in the coastal region of Southeast China[J]. American Journal of Biological Anthropology, 2022, 178(1): 154-170.
[5] Yoshida K, Wakiyama Y, Nakamura Y, et al. Demographic history of the Jomon people: insights from whole-mitogenome analysis[J]. Anthropological Science, 2026, 134(1): 15–28.
[6] Watanabe Y, Ohashi J. Modern Japanese ancestry‑derived variants reveal the formation process of the current Japanese regional gradations[J]. iScience, 2023, 26(3): 106130.
[7] Yang M A. A Genetic History of Migration, Diversification, and Admixture in Asia[J]. Human Population Genetics and Genomics, 2022.
[8] Xu Y, Wiradnyana K, Zhou H, et al. Reconstructing the west-east genetic division in Indonesia using ancient genomes[J]. iScience, 2026, 29(6):115974.
[9] Fujita M, Mizuno F, Yamasaki S. Prehistoric Migration of Homo sapiens in the Ryukyu Islands[A]//Ono R, Pawlik A. The Prehistory of Human Migration: Human Expansion, Resource Use, and Mortuary Practice in Maritime Asia[C]. London: IntechOpen, 2024: 1‑20.
[10] Cooke N P, Mattiangeli V, Cassidy L M, et al. Ancient genomics reveals tripartite origins of Japanese populations[J]. Science Advances, 2021, 7(37): eabh2419.
[11] Gelabert P, Blazyte A, Chang Y, et al. Northeastern Asian and Jomon-related genetic structure in the Three Kingdoms period of Gimhae, Korea[J]. Current Biology, 2022, 32(15): 3211-3223.
[12] Pigati J S, Springer K B, Bennett M R, et al. Independent age estimates resolve the controversy of ancient human footprints at White Sands[J]. Science, 2023, 382(6666): 73-75.
[13] Skoglund P, Mallick S, Bortolini M C, et al. Genetic Evidence for Two Founding Populations of the Americas[J]. Nature, 2015, 525(7567): 104-108.
[14] Castro-Silva M A, Ferraz T, Bortolini M C, et al. Deep Genetic Affinity Between Coastal Pacific and Amazonian Natives Evidenced by Australasian Ancestry[J]. Proceedings of the National Academy of Sciences of the United States of America, 2021, 118(18): e2025739118.
[15] Rasmussen M, Sikora M, Albrechtsen A, et al. The Ancestry and Affiliations of Kennewick Man[J]. Nature, 2015, 523(7562): 457-461.
[16] Postillone M B, Cobos V A, Urrutia C, et al. Mitochondrial DNA Diversity and Evolutionary History of Native Human Populations of Northwest Patagonia (Argentina)[J]. Human Biology, 2020, 91(2): 1-22.
[17] Narasimhan V M, Patterson N, Moorjani P, et al. The Formation of Human Populations in South and Central Asia[J]. Science, 2019, 365(6457): eaat7487.
[18] Moorjani P, Thangaraj K, Patterson N, et al. Genetic Evidence for Recent Population Mixture in India[J]. The American Journal of Human Genetics, 2013, 93(3): 422-438.
[19] Sharma S, Rai E, Sharma P, et al. The Indian origin of paternal haplogroup R1a1* substantiates the autochthonous origin of Brahmins and the caste system[J]. Journal of Human Genetics, 2009, 54(3): 194-201.
[20] Metspalu M, Kivisild T, Metspalu E, et al. Most of the extant mtDNA boundaries in South and Southwest Asia were likely shaped during the initial settlement of Eurasia by anatomically modern humans[J]. BMC Genetics, 2004, 5: 26.
[21] Maji S, Basu S, Mukherjee N, et al. Distribution of Mitochondrial DNA Macrohaplogroup N in India with Special Reference to Haplogroup R and its Sub-Haplogroup U[J]. International Journal of Human Genetics, 2008, 8(1): 85-92.
[22] Basu A, Mukherjee N, Roy S, et al. Ethnic India: A Genomic View, With Special Reference to Peopling and Structure[J]. Genome Research, 2003, 13(10): 2277-2290.
[23] Singh R, Thangaraj K, Singh L, et al. Common genetic heritage and admixture among Indian population groups as revealed by mtDNA markers[J]. Annals of Human Genetics, 2012, 76(6): 487-496.
[24] Desai S, Kumar L, Sylvester C, Krishna M S, Rao J S, Chandrasekar A. South Asian Maternal Lineage haplogroup R30 Provides Phylogenetic Evidence of human dispersal across South Asia[EB/OL]. bioRxiv, 2025.
[25] Chaubey G, Karmin M, Metspalu E, et al. Phylogeography of mtDNA haplogroup R7 in the Indian peninsula[J]. BMC Evolutionary Biology, 2008, 8: 227.
[26] ArunKumar G, Soria-Hernanz D F, Kavitha V J, et al. Population Differentiation of Southern Indian Male Lineages Correlates with Agricultural Expansions Predating the Caste System[J]. PLoS ONE, 2012, 7(11): e50269.
[27] Yelmen B, Mondal M, Marnetto D, et al. Ancestry-Specific Analyses Reveal Differential Demographic Histories and Opposite Selective Pressures in Modern South Asian Populations[J]. Molecular Biology and Evolution, 2019, 36(8): 1628-1642.
[28] Sequeira J J, Vinuthalakshmi K, Das R, et al. The maternal U1 haplogroup in the Koraga tribe as a correlate of their North Dravidian linguistic affinity[J]. Frontiers in Genetics, 2024, 14: 1303628.
[29] Sequeira J J, Krishna M S, van Driem G, et al. Novel 4400-year-old ancestral component in a tribe speaking a Dravidian language [J]. European Journal of Human Genetics, 2025, 33 (12): 1897-1905.
[30] Rowold D J, Chennakrishnaiah S, Gayden T, et al. The Y-chromosome of the Soliga, an ancient forest-dwelling tribe of South India[J]. Gene, 2020, 763: 100026.
[31] Ranasinghe R, Tennekoon K H, Karunanayake E H, et al. A study of genetic polymorphisms in mitochondrial DNA hypervariable regions I and II of the five major ethnic groups and Vedda population in Sri Lanka[J]. Legal Medicine, 2015, 17(6): 539-546.
[32] Ranaweera L, Kaewsutthi S, Tun A W, et al. Mitochondrial DNA history of Sri Lankan ethnic people: their relations within the island and with the Indian subcontinental populations[J]. Journal of Human Genetics, 2014, 59(1): 42-49.
[33] Adachi N, Shinoda K, Umetsu K, et al. Mitochondrial DNA analysis of Hokkaido Jomon skeletons: Remnants of archaic maternal lineages at the southwestern edge of former Beringia[J]. American Journal of Physical Anthropology, 2011, 146(3): 346-360.
Prehistoric Dispersal Model of East‑Asian Maternal Lineages
The Technological Emergence of Prehistoric R Maternal Lineages
Ancient DNA reveals that at Bacho Kiro Cave in Bulgaria, dated to 40 000 years ago (hereafter BK Cave), archaeological finds include personal ornaments such as perforated cave‑bear‑tooth pendants and ivory beads among the grave goods, and the individuals were already close to anatomically modern humans in physical morphology, production technology and lifestyle1. By contrast, the 10 000‑year‑old Longlin individual from Guangxi and the Maludong individual from Yunnan were long mistaken, prior to genetic testing, for non‑sapiens hominins and misidentified as male, lagging behind the female ancient individuals of BK Cave in every aspect of physical morphology and culture.
Furthermore, the AR33K female ancient individual from Northeast Asia, dated to 30 000 years ago, possessed bone‑needle technology, alongside stone grinding tools and the deliberate practice of seed collection, which laid the foundation for and generated demand for pottery production. Consequently, before the large‑scale rapid diffusion of certain R maternal lineages, when they encountered sister branches of M maternal lineages separated by tens of thousands of years, marked differences should have existed across all domains. The physical characteristics of fully‑fledged Late Homo sapiens in the Far East did not derive from post‑Last‑Glacial‑Maximum Guizidong‑like populations of Northeast Asia, nor from pre‑Neolithic Longlin‑like or Maludong‑like populations of South China.
Apart from Late Homo sapiens, all known species within the genus Homo remained confined to the Palaeolithic. Under the survival pressure of confronting Neanderthals after departing Africa, modern humans needed to manufacture projectile weapons, which spawned an entire toolkit and way of life, enabled the fine processing of food, and gave rise to bone needles and bone flutes. Bone needles could be used for ornaments such as hairpins, for sewing clothing, and even for crafting straw sandals, straw baskets, straw boats or skin‑sewn boats, which explains why Native American groups capable of making straw‑type boats are concentrated in only certain regions rather than distributed across all Native American populations.
The technology characterised by standardised microblades, backed small stone tools and composite inset implements was not universally shared by all modern human populations during the Late Pleistocene. Although Neanderthals excelled at close‑quarter combat, no small inset microlithic tools have been found among them; their hunting implements were limited to thrusting spears and hand‑thrown javelins, which constituted one of the advantages later held by modern humans over Neanderthals. If one assumes that humans already possessed microlithic technology upon leaving Africa, it becomes impossible to explain why the Longlin and Maludong individuals still primarily employed core‑flake and pebble tools, and why early Amazonian regions likewise show no Northeast‑Asian‑style wedge‑shaped microblade tradition. This precisely demonstrates that microlithic technology was not stably carried by all populations during their dispersal, but arose independently in different regions.
If microlithic technology were a standard human endowment, then the judgement of modern anthropologists, based on archaeological and physical analyses, that microlithic technology and trade networks did not begin to appear sporadically until nearly 60 000 years ago would be inexplicable. R maternal lineages emerged around 50 000–60 000 years ago, a period for which ancient‑DNA data are currently blank. This interval was in fact the period during which modernising behaviours of Late Homo sapiens emerged, intensified, became stably heritable and began initial diffusion. By the time R maternal lineages appeared in Central Europe around 45 000 years ago, they already represented the early form of anatomically modern humans. These populations, formerly known as Cro‑Magnons and now broadly referred to as early European humans, were in fact the earliest group, 40 000 years ago, to undergo R‑lineage maternalisation in northern Eurasia.
Consequently, fully‑fledged Late Homo sapiens, in the anatomical and behavioural sense, was not a standard accompaniment of the Out‑of‑Africa expansion. The R maternal haplogroup, a downstream branch of N, rose precisely in response to the survival challenge posed by Neanderthals; the onset of R‑lineage diffusion coincides exactly with the beginning of Neanderthal decline. R maternal lineages appeared already equipped with microlithic technology, whereas Neanderthals, as is well known, never invented it. Ultimately, it was perhaps through microlithic technology that the Neanderthal defensive line was breached: 50 000 years ago, Europe was still Neanderthal territory, but by approximately 45 000 years ago, R‑lineage populations carrying microlithic technology had archaeologically occupied regions including Germany and Bulgaria. Although the Campanian supervolcanic eruption near Naples 39 000 years ago interrupted this process, migration from the Near East continued unabated thereafter.
In fact, around 50 000 years ago, N‑lineage populations attempted to expand into Europe, including southeastern France and Germany, but in retrospect they held no decisive advantage over Neanderthals and their diffusion was unsuccessful. The 45 000‑year mark in Europe represents a dividing line: before this point, incoming N lineages, limited by lithic technology that had not yet advanced to microlithic standards, could not gain a substantive advantage over Neanderthals. After this point, when the downstream R branch of N arrived to confront Neanderthals, multiple rounds of natural catastrophes combined with the use of projectile tools led directly to the permanent replacement of Neanderthals. Prior to this, modern humans’ inability to leave Africa for hundreds of thousands of years was precisely because Neanderthals, with their formidable close‑quarter combat capabilities, occupied the Near East and Europe. This also indirectly indicates that the diffusion of R lineages from the Near East occurred later than that of both M and N lineages; notably, the earliest populations to reach the Far East, namely the Australian continent, were mixed M‑N lineage populations with definitively no R lineages.
As a maternal haplogroup whose frequency has risen continuously and rapidly from the Late Palaeolithic to the present, R clearly benefited from microlithic technology, and indeed represents the only major maternal lineage class to benefit from this technological transformation. The survival pressure exerted by Neanderthals caused behavioural shifts in R‑lineage populations, which in turn gave rise to microlithic technology as well as changes in physical morphology and social structure, while simultaneously leaving genetic traces including selective preferences in gene expression. Moreover, R‑lineage populations already practised deliberate seed collection at the time of their divergence, which is why R‑lineage populations across the Americas, South Asia, North Africa, Europe and East Asia were all capable of independently transitioning to the agricultural era.
Analysis of R Maternal Lineage Diversity in East Asia
Among Austroasiatic populations of Indochina, the B and F maternal haplogroups are highly concentrated in B5a1, F1a1 and F1f. Considering that F1a1 is simultaneously distributed across all ethnic groups of East Asia, that the sister branches of F1a, F1c and F1f, are primarily distributed among Tibeto‑Burman populations, and that F2, the sister branch of F1, is essentially absent from Austronesian and Austroasiatic populations, while the subsequently migrated Hmong‑Mien and Kra‑Dai populations of Indochina carry only low frequencies, yet Tibeto‑Burman populations including the Ladakh Tibetans exhibit very high frequencies, the best explanation for this pattern is that the F2 maternal haplogroup diffused later than F1, and therefore entirely missed the diffusion of Austroasiatic and Austronesian populations.
This is analogous to the case of B6, which occurs simultaneously among Sino‑Tibetan populations and Indochina‑related populations, whereas R11, the downstream branch of B6’R11, the sister cluster of B6, is essentially absent from Austroasiatic and Austronesian populations. The R11 maternal haplogroup appeared in the Nen River basin 9 000 years ago, and ancient DNA has also been recovered from the Yangshao culture in Gansu. The maternal lineages of Mongolic and Manchu‑Tungusic populations, which extended outward from the Sino‑Tibetan sphere, all follow the crescent‑belt cultural distribution. Consequently, if one excludes the single‑structured F1a1 and B5a1 branches, Austroasiatic populations are dominated almost entirely by various minor M maternal haplogroups; within Cambodia alone, M20, M12b1a2, M13c, M7b1a1, M17a, M17c, M21b, M23’75, M24, M74b, M46b, M73c, M21b3, M74b3 and M74c have all been identified2.
Similarly, the diversity of B and F/R9 maternal haplogroups among northern Han Chinese and Tibeto‑Burman populations exceeds that among southern Han Chinese, Kra‑Dai and Hmong‑Mien populations, with some branches even being exclusively southern‑specific. For instance, within F1a’c’f, only F1a1’4 can be regarded as a southern‑characteristic branch, and even this is simultaneously distributed across the south, the north, the southwest and Sino‑Tibetan populations. The earliest surviving dates for mainstream B and F/R9 lineages within Southeast Asia are approximately 4 000 years ago, with an upper limit of at most around 6 000 years. This is consistent with the fact that both Austroasiatic and Austronesian populations began large‑scale diffusion into Indochina and the South‑Pacific islands only around 4 000 years ago.
The early hypothesis of a landing from southeastern China would require demonstrating that R maternal lineages originated prehistorically in Sundaland. Yet the branches of Austronesian and Austroasiatic populations are single‑structured with coalescent ages not exceeding 6 000 years, and it is already an international consensus that Austronesian populations initially originated on the southeastern coast before diffusing outward, a pattern evident from both linguistic and maternal‑lineage divergence. Hmong‑Mien and Kra‑Dai populations appeared already equipped with rice agriculture, and possessed matrilineally‑dominated mythological systems; similarly, low‑altitude Tibeto‑Burman populations of the southwest share legends of goddesses descending from high mountains. Their frequencies of B and F maternal haplogroups are also high, and although their diversity is restricted to southern‑specific branches, the number of branches involved far exceeds that of Austronesian and Austroasiatic populations.
Consequently, whether viewed from modern distribution, ancient DNA or current branch diversity, the mainstream East‑Asian B and F/R9 maternal haplogroups can be seen to have originated, prior to their large‑scale Neolithic diffusion, in the region east of the Hengduan Mountains, that is, the present‑day Shaanxi‑Gansu‑Sichuan region. Only in this way could the ABF maternal haplogroups, while diffusing during the Neolithic, simultaneously migrate westward into Central Asia to participate in the formation of the Scythians, move northward into Siberia, expand eastward into the eastern plains, or migrate southward into the southwest and Indochina. Other maternal haplogroups, constrained by geography, could not have produced this modern distributional pattern. If one excludes the dozen or so branches that exploded in frequency during the Neolithic, the upstream sister branches remain today largely among the Sino‑Tibetan populations of western Yunnan‑Guizhou‑Sichuan, and of the Shaanxi‑Gansu‑Sichuan and Yunnan regions east of the Hengduan Mountains.
Therefore, before the Neolithic, the homeland of B and F/R9 maternal haplogroups in East Asia lay in the Shaanxi‑Gansu‑Sichuan region on the northeastern edge of the Qinghai‑Tibet Plateau. During the Last Glacial Maximum, the main body migrated southward along the eastern flank of the Hengduan Mountains, which explains the abundance of early‑diverging minor branches in this region today. After the Neolithic, they expanded southward and into Southeast Asia in an overwhelming manner, which is why F1a1 is distributed not only throughout the south but also the north, while the sister branches of F1a, F1c and F1f, are primarily distributed among Tibeto‑Burman populations. Although F1a1 currently accounts for over 3 % of the population, its coalescent age is only about 9 000 years, reflecting intense Neolithic diffusion. If one focuses on the understanding that, for many populations, B and F/R9 maternal haplogroups are relatively late external arrivals, that their pre‑diffusion homeland lay at higher altitudes, that their diversity is concentrated among the relatively primitive Sino‑Tibetan‑Qiang populations east of the Hengduan Mountains, that Hmong‑Mien and Kra‑Dai populations represent merely an extension, and that Austroasiatic and Austronesian populations were only marginally affected, then certain seemingly anomalous phenomena can be readily explained.
The Initial Paternal Co‑Occurrence of Far Eastern R Maternal Lineages
All these clues point to the existence of a currently undetected population that initially accompanied the mainstream R maternal branches of East and Southeast Asia in their migration to the Far East, jointly introducing ancient Near‑Eastern physical traits into East Asia, traits that were subsequently continuously diluted. This component flowed from north to south, sequentially passing from East Asia into Southeast Asia, and may even have indirectly affected portions of North America during the process. At present, however, it does not appear to have exerted much influence on the Indonesian archipelago, while Melanesia and the Australian continent show almost no trace of this influence. Constrained by the current limitations of molecular anthropology, we remain unable to obtain direct, decisive evidence, but can build a case through the accumulation of various indirect lines of evidence. Here, it is not sufficient to satisfy a single condition; rather, this hypothesis must satisfy more, indeed ideally all, of the conditions compared with alternative possibilities.
I. This paternal lineage was among the earliest groups to depart for the Far East and among the earliest to arrive there. The crucial point, however, is that this population clearly arrived or diffused slightly later than other populations. This not only corresponds to the relatively late diffusion of the mainstream East‑Asian R maternal lineages, but also aligns with my repeated earlier observation that the Australian continent and Melanesia were the least affected by this component, precisely the two regions of the Far East that are most distant and that scholars identify as the earliest destinations of modern human migration. Therefore, setting aside the American continent as the last landmass in the Far East to be reached by humans and thus not a useful reference, my point is that the distribution of this population in the Australian continent and Melanesia should be sparse, or even entirely absent.
II. Early‑diffusing populations inevitably engaged in gene‑flow with local archaic hominins; conversely, later‑diffusing populations encountered this archaic autosomal component later. Correspondingly, since this paternal lineage diffused relatively late, its proportions of archaic hominin components, such as Neanderthal or Denisovan ancestry, and more recently the inferred contribution from Chinese Homo erectus, should be lower than those of other populations.
III. As previously suggested on multiple occasions, R maternal lineages ultimately originated in the vicinity of the Near East. This implies two possibilities for the accompanying paternal lineage: first, that it originated directly in the Near East and carried a portion of local R maternal lineages; second, that it originated outside the Near East but passed through the Near East en route to the Far East. In the first case, sister branches of this population should still persist in the vicinity of the Near East; in the second case, one can only determine whether the migration passed through the Near East through other forms of analysis.
IV. The most crucial point: combining my earlier analysis of mainstream East‑ and Southeast‑Asian R maternal lineages with an unwritten axiom of physical anthropology, namely, that barring extinction or near‑extinction, paternal lineages cannot readily exchange maternal diversity with one another, so that the more isolated a branch at the diffusion terminus, the more single‑structured its maternal profile, the diversity of this paternal lineage should be synchronised with that of B and F/R9. That is, it should be concentrated primarily among Han Chinese and Tibeto‑Burman populations, secondarily among Hmong‑Mien and Kra‑Dai populations (with sporadic distribution), and be least represented among Austroasiatic and Austronesian populations.
V. It should likewise be synchronised with the diffusion of R maternal lineages, meaning that at least one branch should be clearly concentrated in the northeastern fringe of the Qinghai‑Tibet Plateau before the Neolithic, with higher diversity and frequency in the northwest than in other regions. Within China, the distributional characteristic of this paternal lineage should be skewed toward the west.
VI. Finally, one cannot exclude the possibility that, in the absence of substantial admixture with other populations, this paternal lineage retained the physical appearance it carried from the Near East, as noted in the preface, human physical appearance is not easily altered except through admixture. It might therefore exhibit a proto‑Caucasoid morphology, possibly identified by modern Western anthropologists as a population bearing Caucasoid features. However, because this group migrated before the Neolithic, it clearly does not share the same origin as present‑day Near‑Eastern populations. Consequently, crude assessments based solely on non‑recombining regions would classify it as East‑Asian; while genetic analysis programs might detect traces, they might not reveal a direct relationship with Near‑Eastern populations. Thus, even visibly apparent Caucasoid features would ultimately be categorised as “pseudo‑Caucasoid.”
The Far‑Eastern paternal lineage that satisfies all of the above conditions is in fact D1‑M174. Geographically, the vast majority of the D1‑M174 population is almost exclusively restricted to East Asia, with the remainder distributed at low frequencies across the countries at the Indochina–southwest China border. Furthermore, over more than a decade of molecular‑anthropological research, the indigenous tribes of the Indonesian archipelago, Philippine archipelago, Melanesia and the Australian continent have been repeatedly tested. The current situation is that these indigenous tribes are dominated by K2‑M526 and C1b‑F1370, downstream branches of CF‑P143, with no trace of D1‑M174 whatsoever.
D1b‑L1378, the branch of D1‑M174 that penetrated furthest into the Far East, has currently been commercially detected only near the Cebu region of central Philippines, an area lacking indigenous marginal tribes, as well as in Indochina and the Malay Peninsula. It is suspected to have diffused prehistorically into northern Sundaland, but judging from its modern geographic distribution it clearly did not penetrate into the Indonesian archipelago or Australasia, where K2‑M526 and C1b‑F1370 are found. In other words, not only is it restricted to west of Wallace’s Line, but it has also not been detected among the numerous marginal tribes of southern Sundaland, the present‑day Indonesian islands of Sumatra, Java and Borneo.
Even setting aside other factors, the modern geographic distribution alone suggests that D1‑M174 arrived slightly later than the contemporaneous CF‑P143 downstream branches K2‑M526 and C1b‑F1370, or at least penetrated the Far East slightly later. The precise time difference remains unknown, but given that all these paternal lineages were among the early arrivals in the Far East, an interval of several thousand years is plausible, sufficient to produce this geographic distributional difference.
Considering further that the coalescent age of the entire extant D1‑M174 lineage is estimated by various institutions at approximately 45 000 years, that archaeological evidence from the Ryukyu Islands indicates human habitation at least 35 000 years ago, and that the oldest sites on the northern fringe of the Qinghai‑Tibet Plateau date to nearly 40 000 years ago, I hypothesise that D1‑M174 began its eastward migration from the vicinity of the eastern Mediterranean coast 45 000 years ago. Subsequently, between 35 000 and 40 000 years ago, D1a1‑F6251 and D1a2‑M55 successively arrived in the vicinity of the Altai Mountains and the Kamchatka–Japanese archipelago region. The remaining D1‑M174* may have travelled directly southward, penetrating into Sundaland, but modern data indicate it did not cross east of Wallace’s Line.
Coincidentally, Neanderthal and Denisovan genes are precisely widely and frequently distributed east of Wallace’s Line, including the Philippine archipelago, Melanesia and the Sahul continent3. Their Denisovan proportions are demonstrably higher than those of other populations across all studies4, and Oceanian populations have been definitively shown to carry substantial Denisovan immune‑system gene segments, the result, of course, of prolonged gene‑flow and contact5. As previously noted, the highest Denisovan component was detected among the Ayta Magbukon Negritos of the Philippines, a population dominated by paternal K2b‑P331.
Indigenous populations of Papuan‑Melanesia and Australia carry rare RHD (Rh blood group) system variant combinations identical to those found in Neanderthals6. This means that if a Neanderthal living in modern society required an emergency blood transfusion, seeking this blood type in Indigenous communities of New Guinea and Australia would offer the highest probability of finding a matching blood type. This phenomenon can only have arisen through gene‑flow with archaic hominins. This also explains why Neanderthal ancestry is higher in Australia–Melanesia than in East–Southeast Asian populations, higher in East–Southeast Asia than in European populations, and higher in Europe than in North Africa–Africa. A reasonable explanation for this proportional gradient is that prehistoric E‑M96 populations engaged in little or infrequent gene‑flow or contact with Neanderthals; CF‑P143 and D1‑M174 paternal lineages may have had partial gene‑flow with Neanderthals upon leaving Africa; while the F‑M89 downstream branch K2‑M526, and especially K2b‑P331, engaged in frequent gene‑flow with Neanderthals historically.
Consequently, the geographic distribution of high Neanderthal and Denisovan proportions completely avoids the distributional range of D1‑M174. Furthermore, current research on the Jōmon has confirmed that their Denisovan and Neanderthal components are the lowest among all ancient and modern East‑Asian populations, even equivalent to modern West‑Eurasian levels7. Researchers argue that this can only indicate that the Jōmon derived from a basal East‑Asian lineage that had limited contact with Denisovans, and Neanderthals, acquiring only a small Denisovan component through contact with other East Asians during the late Jōmon period. This early‑diverging modern human lineage in East Asia, which was barely affected by Denisovan admixture, is precisely the early‑arriving D1‑M174.
At minimum, this indicates that the Jōmon did not participate extensively in the admixture between early Far‑Eastern humans and archaic hominins. Other related paternal branches have not yet been explicitly studied in this regard, but the pattern should hold. The characteristic East Asian and Native American EDAR 370A mutation is essentially absent among the Jōmon. The Jōmon also lack the shovel‑shaped incisors found in most East Asian and Native American populations; shovel‑shaped incisors were initially thought to be related to Homo erectus, and many excavated Homo erectus fossils exhibit this dental trait.
In terms of tooth size, the largest teeth worldwide are found among Indigenous Australians, followed by Melanesians, Micronesians, sub‑Saharan Africans, Native Americans and Philippine Negritos. Populations in the intermediate range include East Asians, Southeast Asians and Polynesians. The smallest teeth are found among West Eurasians, Japanese Jōmon and modern Japanese Ainu; notably, these small‑toothed populations were also the earliest to use pottery cooking for food preparation8. As previously noted, the Maludong individual of Yunnan, the Longlin individual of Guangxi, the Qihedong individuals of Fujian and Liangdao 1 all exhibit larger teeth. By contrast, the B and F/R9 maternal lineages that directly transitioned into the mature Neolithic exhibit small teeth. Beyond size, Christy G. Turner II, in comparing dental morphology between the Americas and Sundaland, also found significant differences between the Jōmon and the shovel‑shaped incisors of the former.
The paternal lineages of modern Ainu are composed of approximately 82 % D‑M55* indigenous branches, around 7 % D1a2a1a‑M125 Yamato branches (possibly introduced later), and approximately 12 % C‑M217* from the Nivkh of Sakhalin (incorporated in relatively recent times)9. Considering that the Nivkh have not been found to carry D‑M55*, and that the Ainu possess at least a substantial proportion of North‑Asian maternal elements, this gene‑flow proceeded from the Nivkh into the Ainu. Furthermore, due to influence from the indigenous populations of the lower Amur River and Sea of Okhotsk regions, direct descendants of Guizidong‑like populations, later Ainu frequently exhibit a mixed physical appearance combining flat facial profiles with dense body hair. This is why late‑19th‑century Western anthropologists photographing the Ainu observed that Ainu husbands and wives often presented completely different appearances.
As for origin in, or passage through, the Near East, all early Far‑Eastern paternal lineages appear to satisfy this criterion in my view. K1‑L298, the sister branch of K2‑M526, is currently partially distributed in the Near East. C1a‑V20, the sister branch of C1a‑M8 and C1b‑F1370, was also among the earliest paternal lineages to participate in the European process. Similarly, D2‑FT75, the sister branch of D1‑M174, is currently distributed in the Near East–West Africa region. On this point, therefore, there is little difference between the various lineages.
Judging from modern distribution, early C1b2‑Z31885 and K2‑M526 may also have carried some NR maternal lineages, which could explain the presence of a certain proportion of N13, N14, O and S among indigenous Europeans. The diversity of the P maternal haplogroup is distributed across the Philippine archipelago and Melanesia, and P lineages migrated into Australia approximately 20 000 years ago during the Last Glacial Maximum, shortly thereafter becoming the dominant maternal branch of Melanesian and Australian Indigenous populations. The P5 maternal haplogroup is also found in India and among the Tamil of Sri Lanka, while P4a has been detected in Sri Lanka and is related to South Asia. However, due to the extreme scarcity of relevant ancient‑DNA information, and because these are clearly not the maternal branches that later underwent large‑scale diffusion while carrying the characteristic modern physical traits of the Far East, and likewise because information on Southeast Asian R21, R22, R23, N7, N8, N11, N21 and N22 is currently too sparse, the present study will not involve judgement or analysis of these maternal lineages.
Regarding the synchronous diffusion of paternal and maternal lineages, D1a1‑F6251 is the only paternal lineage satisfying the criterion of highest diversity concentrated among Sino‑Tibetan populations, followed by Hmong‑Mien and Kra‑Dai populations, with the lowest R‑maternal diversity among Austroasiatic and Austronesian populations. The paternal difference between southern Han, Hmong‑Mien and Kra‑Dai populations on the one hand, and Austroasiatic and Austronesian populations on the other, is precisely that the former carry a certain proportion of D‑F1070 paternal frequency, while the latter carry no D1a1‑F6251 branch frequency whatsoever.
This is precisely why Kra‑Dai, Austronesian, Hmong‑Mien and Austroasiatic populations all carry the core East‑Asian autosomal B and F/R9 maternal lineages that diffused southward: only the southern branches of B and F/R9 are present, and the more peripheral Austronesian and Austroasiatic populations exhibit extremely single‑structured branches. Neither Kra‑Dai nor Hmong‑Mien populations possess northern branches, whereas Tibeto‑Burman populations, in which D1a1‑F6251 participated deeply, directly possess the full spectrum of branches.
Although Kra‑Dai and Hmong‑Mien populations likewise possess diverse B and F/R9 lineages, their characteristic feature, excluding recent Han Chinese admixture, is the near‑absence of northern branches. By contrast, among certain Tibeto‑Burman populations of Sichuan and later‑migrated groups in Yunnan and Guizhou, B and F/R9 are dominated by northern branches yet also span both north and south, occupying a certain proportion in each.
Furthermore, because D‑F1070 split from the main D‑F849 body only 20 000 years ago during the Last Glacial Maximum, its branch diversity is presumably lower than that of D‑Z27269. Consequently, the B and F/R9 lineages of southwestern, Hmong‑Mien and Kra‑Dai populations are restricted to specific southern branches with no northern branches, whereas Tibeto‑Burman populations, where paternal D1a1‑F6251 is clearly high‑frequency, simultaneously possess both northern and southern branches.
The distribution of D1a1‑F6251, which accounts for an average of 2.5 % of the Chinese population, is clearly not uniform. According to data from early studies, its frequency in northern and western China exceeds the national average: Shaanxi Han at 9 %, Gansu Han at 6 %, Yunnan Han at 4.4 %, Guangxi Han at 3.7 %, Hunan Han at 3.3 %, Sichuan Han at 3.2 %. By contrast, Han populations in eastern coastal provinces including Jiangsu, Zhejiang and Fujian carry only approximately 1–1.5 %; some localities in Gansu, Sichuan, Guizhou and Yunnan even exceed 10 % in Han sampling10, while certain southeastern coastal samples approach 0 %.
In terms of population density, the D1a1‑F6251 population is primarily concentrated in the Shaanxi‑Gansu‑Sichuan region; in terms of population frequency, D1a1‑F6251 is highly concentrated in the three provinces of Tibet, Qinghai and Gansu. Overall, therefore, there is a decreasing trend from northwest to southeast, with the west exhibiting higher diversity and population than the east. The official distribution frequency of D1a1a1a1‑Z27269 likewise shows concentration in western regions and the lowest frequency in the southeast11.
From an ancient‑DNA perspective, the earliest D1a1‑F6251 sample to date comes from the Wangjiayinwa site in Tianshui, Gansu, dated to 5 750 ± 200 years ago. Therefore, examined from multiple perspectives, modern genetic research, ancient genetic research, and ethnohistorical records, prehistoric D1a1‑F6251 can be essentially confirmed to have originated in the Hehuang region of the middle‑upper Yellow River, west of Lanzhou, and historically diffused continuously southward into present‑day western Sichuan, with some branches expanding eastward into the plains, and later, during the Majiayao period, a portion migrating onto the Qinghai‑Tibet Plateau. Its initial diffusion centre lay in the vicinity of Gansu.
D1a1a1b‑F1070, a sub‑branch of D1a1‑F6251, was a relatively early southward‑migrating lineage, splitting from the main D1a1a1‑F849 body during the Last Glacial Maximum. Among its downstream branches, apart from D1a1a1b1a‑Z41068, formed 3 500 years ago and concentrated in Guangxi, other branches such as D‑Z41207 are essentially concentrated in the middle‑upper Yangtze River basin, including Hunan and Guizhou. Another minor sister branch of D1a1a1b‑F1070, D‑MF56257, is currently distributed in Sichuan and Yangtze River basin provinces. As for other paternal lineages, the western Tibeto‑Burman O2a‑M134 is essentially represented by western‑skewed branches, particularly O‑CTS5308 with its strong founder effect. By contrast, paternal D1a1‑F6251 exhibits no founder effect in the west and possesses high branch diversity. At present, D1a1‑F6251 is the only major paternal branch with clearly western attributes.
Finally, according to modern Western anthropologists such as Nikolai Tscheboksarow of the Soviet Union, the Ainu of Hokkaido, Japan, the western Sichuan region of China, and certain Taiwanese Indigenous populations carry admixed Caucasoid autosomal ancestry, resulting in proto‑Caucasoid physical traits. During the 19th and 20th centuries, numerous prominent scholars who conducted fieldwork on Ainu culture and language, including the British missionary John Batchelor, the French anthropologist George Montandon, and further specialised physical anthropologists such as the German Egon von Eickstedt, the American Marie Inez Hilger, the American Carleton S. Coon, the British Isabella Bird and the British Thomas Wright, unanimously concluded that the Ainu bear Caucasoid features, describing them, in their terms, as Eurasian proto‑Caucasoid remnants. Some claims suggest the Ainu admixed with prehistoric Russian populations, but no relevant traces have been found in either paternal or maternal lineages.
Some individuals deliberately seek out flat, degenerate‑type Ainu resulting from large‑scale admixture between Ainu and Nivkh after the 20th century, but this is meaningless. In fact, numerous professional Western anthropologists conducted fieldwork at a relatively primitive stage, travelling personally to the field early enough and possessing the foundational training of professional anthropology. The Ainu, as one of the populations that remained largely untouched by modern civilisation until recent times, can be regarded as belonging to the first tier in terms of technological level and cultural customs, a conclusion that requires only repeated comparison with the myriad marginal tribes of South Asia, Southeast Asia, Australia, South America and sub‑Saharan Africa.
As for the western Sichuan region mentioned by Nikolai Tscheboksarow, molecular anthropology subsequently revealed that western Sichuan is a high‑frequency distribution area for D1a1b1‑P47, while the Ainu are a high‑frequency area for the non‑Yamato branch D1a2a‑M55*, and Taiwanese Indigenous populations inherited high‑frequency B and F/R9 maternal lineages together with founder‑effect O1a‑M119 and O2a‑M324.
Early physical anthropology classified Tibetan populations into two types. The first, called the monastic type or Tibetan A type, is primarily distributed in the Ü‑Tsang region and exhibits brachycephaly, euryprosopic facial form, a broad and flat face, a relaxed mid‑face, small mastoid processes, a flat external occipital protuberance, and weak supraorbital ridges. The second, called the warrior type, Khampa type or Tibetan B type, is primarily distributed in the Kham and Amdo regions and exhibits dolichocephaly, a longer anteroposterior and narrower transverse cranial dimension, a long and narrow face with stronger three‑dimensional depth, a projecting nasal bone, robust supraorbital ridges, prominent and projecting mastoid processes, a pronounced external occipital protuberance, and clear supraorbital elevation.
According to currently available official data on the proportion of paternal D1a1b‑P47 in Tibetan regions: in Ü‑Tsang, Xigazê Tibetans at approximately 40 %, Lhasa Tibetans at approximately 48 %, Shannan Tibetans at approximately 38 %, and Ngari Tibetans at approximately 30 %. In Amdo, southern Gansu Tibetans at approximately 52 %, Qinghai Tibetans at approximately 48 %, and Nagqu Tibetans at approximately 54 %. Finally, in Kham, Qamdo Tibetans at 62 %, western Sichuan Tibetans at 57 %, and Muya people at 60 %12. According to larger‑scale statistics, the distribution of D1a1b‑P47 in Tibet, from lowest to highest frequency, follows the pattern: Xigazê and Shannan at approximately 40 %, Ngari and Lhasa at approximately 55 %, and Nyingchi, Qamdo and Nagqu at approximately 70 %13.
As for the Andaman Islanders: when British colonists landed on the Andaman Islands in the 18th century, the Great Andamanese‑language population, dominated by K2b‑P331 with a small proportion of other F‑M89 branches, was roughly estimated at approximately 5 000 individuals, while the Ongan‑language population, dominated by D1a2b‑Y34637, was collectively estimated at nearly 1 000 individuals. This means that, excluding the impact of modern colonialism, the former population was several times larger than the latter. Nevertheless, for both K2‑M526 and D1‑M174, the Andaman Islanders, due to long‑term geographic isolation and strong genetic drift, exhibit small effective population sizes and low branch diversity. For studying K2‑M526, priority should be given to Papuan‑related populations; for D1‑M174, one should select the more branch‑diverse Tibeto‑Burman, Qiang and Jōmon populations. Although the K2b‑P331 branch among Andaman Islanders has not yet been sub‑typed, it is presumed to resemble the D1‑M174 situation in consisting of branches with very recent coalescent ages.
My point here is not to bind the Y chromosome deterministically to physical appearance, but to indicate a propensity suggested by existing data, essentially a matter of probability. Furthermore, during the Neolithic, before large‑scale paternal‑maternal fusion among Chinese populations, physical differences genuinely existed. Although fusion had essentially homogenised populations in East Asia by 4 000 years ago, and even more so today, this does not mean such differences persist into the present. Moreover, even populations that appear to practice endogamy in isolation today may already have undergone relatively recent admixture with other groups at the time of their historical appearance; purely unaffected populations do not exist.
Numerous Other Cryptic Evidences Concerning R Maternal Lineages
If one revises the initial assumption that the maternal lineages accompanying D1a1‑F6251 were drawn from the D and G haplogroups among the five major Tibeto‑Burman maternal haplogroups A, B, D, F and G, and instead proposes that they were A, B and F, then all the self‑contradictions are instantly resolved. Most importantly, one needs to observe Tibeto‑Burman populations in southeastern Tibet and northeastern India, such as the Deng and Monpa, whose paternal O‑M134 frequency can exceed 95 %; their D, G and M9 maternal haplogroups are consistently higher across various studies than those of Tibetans and Lhoba14. The Naga, dominated by paternal O‑M122, also possess distinctive maternal haplogroups including M49, M55, M72 and M83. Among these, M49, M55 and M83 also occur among the Chin, who are dominated by paternal O‑M122 and O‑M95, while M84 is jointly distributed among the Chin and the Rakhine, the latter additionally possessing distinctive M24 and M82 maternal haplogroups. Furthermore, M90 occurs among the Karen, and M91 among the Dawei15.
Whether one considers M49, M72 and M83 in Myanmar and its surrounding regions, or M54, M55 and M84 distributed in the borderlands between Myanmar and northeastern India with numerous minor sub‑branches, or M24, M90 and M91 distributed across Myanmar and southwestern China, the populations in all these regions can be characterised as paternal O‑M122 populations. Additionally, the Human Osteoarchaeology Laboratory of Zhengzhou University has confirmed that at the Shuanghuaishu site, where paternal O‑M117 predominates, the highest‑frequency maternal haplogroup, at approximately 18 %, is M46. M46, together with M13 and M61, belongs to the sister branches of M13’46’61 and occurs simultaneously among Tibeto‑Burman and Austroasiatic populations. M61a on the Qinghai‑Tibet Plateau also occurs in the southwest, and its sister branch M61b later migrated southward into Indochina together with Kra‑Dai and Austroasiatic populations.
At present, however, the downstream branches of M46 are essentially restricted to Austroasiatic populations of Indochina, such as Cambodia, and Thailand also carries a certain frequency. M13c is distributed across Yunnan and Indochina; it has been detected, albeit at low frequency, among the Dai of Yunnan, indirectly reflecting that Austroasiatic populations arrived in Southeast Asia earlier than Kra‑Dai populations. M13a also occurs at a certain frequency in Tibet, as well as among the De’ang (Palaung)‑speaking Austroasiatic populations of Yunnan and in India‑Myanmar border regions.
M13’46’61 was originally an indigenous maternal haplogroup of early southwestern Chinese populations, associated for instance with the F2‑M427 paternal lineage primarily distributed among Austroasiatic populations. As O‑M117, serving as the outer‑perimeter and main vanguard of Tibeto‑Burman diffusion, expanded into southwestern China, it inevitably encountered the M13’46’61 maternal haplogroup. Although M46 is now essentially distributed among Austroasiatic populations of Indochina, its sister branches M13 and M61, both belonging to M13’46’61, are precisely the major non‑C, non‑D, non‑G M maternal haplogroups among Tibetans, particularly in the lower‑altitude regions of southern Tibet and northern Myanmar where O‑M134 is distributed. Austroasiatic populations such as the Wa and Lahu of Yunnan, whose paternal pool is dominated by O‑M117, O1b1‑M95 and N, supplemented by low‑frequency C‑M217 and F2, provide further examples. Under conditions where the frequencies of D and G maternal haplogroups were difficult to reduce among prehistoric indigenous populations, the preference was to gradually replace low‑frequency maternal haplogroups such as M46 with B and F/R9 lineages. Early Central Plains sites also yielded maternal haplogroups that accounted for a substantial proportion but could not be classified as D or M7–12, yet these are almost invisible today.
The Munda, an Austroasiatic people of India, as well as Tibeto‑Burman populations near the Himalayas and the Ahom of Assam, a Kra‑Dai people, are all dominated by paternal O‑M175 and generally exhibit low frequencies of B and F/R9 maternal haplogroups. By contrast, the Bhutia of Sikkim, whose paternal D1a1b‑P47 reaches a high frequency of 35 %16, possess high frequencies of F maternal haplogroups. Furthermore, the Khasi of northeastern India, whose paternal pool is composed of O‑M95, O‑M175*, O‑M134, O‑M122, P‑M45, R‑M173, F‑M89, C‑M217, K‑M9 and H‑M69, carry minor M maternal haplogroups including M48, M49, M50, M31c and M33b. Among these, M33a reaches 55 % frequency in the Garo region but only 5 % among the Khasi, while M33b has been detected at only 0.4 % among the Khasi but accounts for 22 % among the Pnar, who are dominated by paternal O‑M17517.
This is not merely a question of maternal frequency and diversity; certain cultural customs also offer clues. For instance, before modern times, tribal populations across Southeast Asia, including Indochina, the Indonesian archipelago and the Philippines, that carried high frequencies of B and R9 maternal haplogroups all adopted hand‑to‑mouth eating practices similar to those of India. The problem is that prehistoric Sino‑Tibetan‑related populations, as attested by the early Zongri site, had already begun using eating utensils, meaning that the manner of eating itself changed during the migration from East Asia to Southeast Asia. A reasonable explanation for this is that B and F/R9, as external maternal lineages, could not alter the long‑established local eating traditions and instead had to adapt to local customs.
The currently dominant R maternal branches in East Asia originally shared a common origin with D1a1‑F6251 before the Neolithic, and in the most recent few millennia after the Neolithic, they achieved massive population expansion and diffusion alongside the far larger paternal O‑M175 population base. The two are not mutually contradictory, and in the course of research one must of course account for the possibility that the diffusing population and the original autosomal source population were not identical.
References
[1] Hublin J J, Sirakov N, Aldeias V, et al. Initial Upper Palaeolithic Homo sapiens from Bacho Kiro Cave, Bulgaria[J]. Nature, 2020, 581(7808): 299-302.
[2] Kloss-Brandstätter A, Summerer M, Horst D, et al. An in-depth analysis of the mitochondrial phylogenetic landscape of Cambodia[J]. Scientific Reports, 2021, 11(1): 10816.
[3] Teixeira J C, Jacobs G, Hudjashov G, et al. Widespread Denisovan ancestry in Island Southeast Asia but no evidence of substantial super-archaic hominin admixture[J]. Nature Ecology & Evolution, 2021, 5(5): 616-624.
[4] Vernot B, Tucci S, Kelso J, et al. Excavating Neandertal and Denisovan DNA from the genomes of Melanesian individuals[J]. Science, 2016, 352(6282): 235-239.
[5] Choin J, Mendoza‑Revilla J, Arauna L R, et al. Genomic insights into population history and biological adaptation in Oceania[J]. Nature, 2021, 592(7855): 583‑589.
[6] Condemi S, Mazières S, Faux P, et al. Blood groups of Neandertals and Denisova decrypted[J]. PLoS One, 2021, 16(7): e0254175.
[7] Yang J, Peyrégne S, Gakuhari T, et al. An early East Asian lineage with unexpectedly low Denisovan ancestry[J]. Current Biology, 2025, 35(20): 4898-4908.e4.
[8] Hanihara T, Ishida H. Metric dental variation of major human populations[J]. American Journal of Physical Anthropology, 2005, 128(2): 287-298.
[9] Tajima A, Hayami M, Tokunaga K, et al. Genetic origins of the Ainu inferred from combined DNA analyses of maternal and paternal lineages[J]. Journal of Human Genetics, 2004, 49(4): 187-193.
[10] Zhong H, Shi H, Qi X B, et al. Extended Y chromosome investigation suggests postglacial migrations of modern humans into East Asia via the northern route[J]. Molecular Biology and Evolution, 2011, 28(1): 717–727.
[11] Luo L T, Liu Y L, Liu Y L, et al. Paternal genomic history and Y‑chromosome phylogeny from the Chengdu Plain reveal multiple Indigenous East Asian farmer contributions to ancient Shu and their descendants[J]. BMC Biology, 2026, 24(1): 54.
[12] 王飞,王萌,张兴华,等。中国西南地区 3 个隔离人群遗传亚结构分析 [J]. 遗传,2022, 44 (5): 424-431.
[13] Qi X B, Cui C Y, Peng Y, et al. Genetic Evidence of Paleolithic Colonization and Neolithic Expansion of Modern Humans on the Tibetan Plateau[J]. Molecular Biology and Evolution, 2013, 30(8): 1761-1778.
[14] 毛乙臻,王飞,刘雨佳,等。线粒体DNA基因组揭示的白马人群的遗传结构 [J]. 中国科学:生命科学,2025, 55 (1): 153-167.
[15] Li Y C, Wang H W, Tian J Y, et al. Ancient inland human dispersals from Myanmar into interior East Asia since the Late Pleistocene[J]. Scientific Reports, 2015, 5: 9473.
[16] Debnath M, Palanichamy M G, Mitra B, et al. Y‑chromosome haplogroup diversity in the sub‑Himalayan Terai and Duars populations of East India[J]. Journal of Human Genetics, 2011, 56(11): 765–771.
[17] Reddy B M, Langstieh B T, Kumar V, et al. Austro-Asiatic Tribes of Northeast India Provide Hitherto Missing Genetic Link between South and Southeast Asia[J]. PLoS ONE, 2007, 2(11): e1141.
The Far Eastern Paleo Mediterranean Ghost Hypothesis
A Retrospective of the Diffusion History of Mainstream East Asian Maternal Lineages
The B and F/R9 maternal haplogroups arrived in southern China in succession approximately 9 000 years ago, and subsequently landed on Taiwan around 6 000 years ago before diffusing outward to the Indonesian archipelago, the Philippine archipelago and elsewhere. Austronesian populations initially formed through the fusion of B4a1a and M7c; the latter is now distributed across southern and eastern China but is rare among western Tibeto‑Burman populations. After this fusion, the E maternal haplogroup was gradually marginalised, while simultaneously a tentative diffusion toward Indochina began on another front. Thereafter, with the onset of the Neolithic, the diffusion speed of B and F maternal haplogroups greatly outpaced that of the paternal D1a1‑F6251.
The original maternal composition of Indochina should have been dominated by M‑rooted branches that remain extremely rare in East Asia today, such as M5, M13c, M20, M21 and M60. This was followed by a wave of diffusion of the N9a sub‑branch N9a6, which now reaches high frequency in Indochina, although this diffusion did not fundamentally alter the maternal structure. Similar small‑scale diffusions may have included R21, R22, R23, N21 and N22, lineages that appeared earlier in Indochina, have unknown origins, and have not been detected in East Asia or Melanesia. This was followed by another wave of F1a1 diffusion, which fundamentally transformed the maternal structure of Indochina, brought the region fully into the late Neolithic, and remains the highest‑frequency maternal branch in Indochina today. During the subsequent Bronze and Iron Ages, additional branches including F1c1a2, F1e, F1f, B5a1a, B5a1d, G2b1a and M7b1a1, mainstream maternal branches with nationwide distribution in China, entered the region.
When D1a1‑F6251 migrated southward from the Altai Mountains and reached the Gansu region in the west, O‑M175 paternal lineages had already spread across most of eastern China. After D‑F6251 and the B and F/R9 maternal haplogroups arrived in East Asia, their pre‑Neolithic homeland lay roughly at the northeastern corner of the Qinghai‑Tibet Plateau, i.e. the Gansu region. Their subsequent diffusion onto the Qinghai‑Tibet Plateau was a local, nearby expansion, which explains the high frequency of D1a1b1‑P47 on the Plateau today. The large‑scale migration occurred during the Majiayao phase of the Yangshao culture, approximately 5 000 years ago; multiple painted‑pottery sites in the Majiayao style have been found on the Qinghai‑Tibet Plateau dating to over 4 000 years ago.
The diffusion timings of R9 and B maternal haplogroups were not entirely synchronous; the former appears to have been shielded by the latter in the western rear. Judging from modern distribution, certain B‑lineage branches migrated deeper into the Far East at an earlier stage, which explains why the Americas carry B2 but no F maternal haplogroups, why prehistoric Japan likewise possessed B4e but no F lineages, and why B frequencies exceed F frequencies among Austronesian, Hmong‑Mien and Austroasiatic populations. This indicates that B maternal lineages migrated and diffused into the Far East earlier, and expanded eastward earlier during the Neolithic.
D‑F6251 is the principal branch of D‑M174 that migrated prehistorically into the Far East. Judging from both ancient DNA and modern data, Japan should possess no F/R9 maternal branches, and even among B lineages only B4e2 is present. By comparison, the Jōmon people, inhabiting a similarly insular, peripheral environment, achieved a higher civilisational level than Melanesian populations, yet because of their marginal location they could not benefit from civilisational collisions, technological upgrading or population‑scale expansion. The advantage, however, was that they could preserve their own subjectivity and remain relatively insulated from surrounding populations.
Judging from ancient DNA and branch divergence dates, these lineages diffused relatively late in East Asia and even later in Southeast Asia. The D4 maternal haplogroup had already become the dominant lineage in North and Northeast China during the Last Glacial Maximum, and its high‑frequency branches diverged at that time; similarly, M7b’c had long been a dominant maternal lineage in the south and had diverged early. By contrast, B and R9 maternal haplogroups increased sharply in frequency simultaneously across both north and south, and their diffusing branches all expanded dramatically around 10 000 years ago, synchronised with the eastward diffusion of Neolithic technology.
The Mosuo, a matrilineal society, and their related ethnic groups, the Naxi and Pumi, carry high frequencies of the D1a1b‑P47 branch1. The B4 maternal haplogroups of the Naxi and Pumi, like those of the Qinghai‑Tibet Plateau, are primarily B4d1, and they also carry high frequencies of F1b* distinct from F1b1; considering that the Baima likewise carry high frequencies of non‑F1b1 F1b, this pattern is notable. A further characteristic of the Mosuo is their high combined frequency of B and F maternal haplogroups: B accounts for 30 % and F for 21 %, together exceeding 50 %, and the Naxi follow the same pattern. The core ancient Sino‑Tibetan population underwent comprehensive diffusion approximately 9 000 years ago, expanding simultaneously northward into the Altaic linguistic alliance, southeastward into Kra‑Dai, Austronesian, Hmong‑Mien and Austroasiatic populations, southward into Tibeto‑Burman groups, eastward into Sinitic populations, and westward into Elamite and Scythian populations.
Consequently, although B and F/R9 maternal haplogroups now account for nearly one‑third of the Chinese population, this is essentially the result of intense diffusion over the past few millennia. This also explains why Tibeto‑Burman populations in southern Tibet, northern Myanmar and northeastern India, who are almost purely O‑M134, are dominated by D, G and M9 maternal haplogroups with few A, B or F lineages. The more easterly Dawenkou culture possessed almost no B or F/R9 branches apart from B5b2, whereas the Yangshao culture of Henan has now yielded essentially all the B and F/R9 branches shared by Sino‑Tibetan populations. These maternal branches subsequently appeared in the Longshan culture of Shandong, and some also occur among Ladakh Tibetans. A small number of non‑Sino‑Tibetan maternal branches in the northwest and Central Asia, having originally resided in the upper Yellow River region, diffused simultaneously toward Central Asia and North China, primarily during the Yangshao culture, and also expanded southward to participate in the formation of Tibeto‑Burman populations, northward to contribute to the formation of Altaic‑Turkic populations in North Asia and Central Asia, while the northeastern branches later participated in the formation of Japanese and Korean populations.
What remains to be resolved is the complementary question of northern versus southern migration routes. If the southern route were valid, it would require numerous archaeological sites; however, given the acidic soils and poor preservation conditions along the southern route, in contrast to the relatively good preservation in the permafrost of the northern route, almost no corroborating human remains have been found along the southern route to date, and prehistoric human traces are likewise lacking. Internationally, it is currently inferred that the B and F maternal haplogroups of East Asia took the northern route2.
“Entities should not be multiplied beyond necessity” applies not only to various fields but also to molecular anthropology: whatever can be concluded through simple logical deduction should not be burdened with additional, unsubstantiated complex hypotheses. For instance, when archaeology, history and modern distribution collectively confirm that D1‑M174 is generally northern‑distributed, there is no need to hypothesise a southern route. A southern route would require demonstrating that D1‑M174 reached and resided as a dominant branch in the Indonesian archipelago and east of Wallace’s Line, yet the available data show no such pattern. Historically, no scholar has ever proposed that the Tibetan‑Qiang peoples represented by D1a1‑F6251 diffused from south to north. In other words, a southern route would further require proving that D1a1‑F6251 first diffused from south to north and then, for no apparent reason, migrated southward again within the past millennium. Such a conclusion demands additional hypotheses, multiplying entities unnecessarily and rendering the theory precarious. The correct approach, given that Sundaland generally lacks indigenous peripheral tribes carrying D1‑M174 and that history has already provided the migration routes of the prehistoric peoples it represents, is to prioritise the northern route.
In fact, the academic community rejected the possibility of a purely southern route long ago; the northern route holds an important place in the settlement history of East Asia. The current debate concerns whether, given the coexistence of southern and northern routes, the two populations experienced long‑term intermixing or long‑term isolation. Current evidence suggests that the former possibility is far more likely than the latter, that is, northern and southern route populations intermingled and exchanged genes over a long period after arriving in northern East Asia 3. The autosomal ancestry of the entire Tibeto‑Burman language family, particularly Tibetans, is even more northern‑shifted than that of northern Han Chinese; the Jōmon likewise lean toward Northeast Asia. During the era of Wu Xinzhi (吴新智), craniometric analyses likewise proposed that the Japanese Jōmon originated from the northeastern region of the mainland.
From a distributional perspective, as detailed earlier, the geographic distribution of D1‑M174 (centred on the entire Far East including the Sahul continent) is also overall northern‑skewed. In China, not only the southeastern coast but also southern regions such as Hainan have indigenous populations whose paternal lineages are essentially dominated by O1a and O1b1, with no D, N or Q paternal lineages present4. F‑Y27277 is genuinely concentrated in the southwest and represents the East Asian mainstream paternal lineage with the greatest likelihood of a southern route, yet ancient‑DNA evidence remains lacking5.
Research on population migration routes draws not only on non‑recombining regions but also on certain special blood types, such as GM and HLA blood types, highly polymorphic immunogenetic markers. From an HLA perspective, the Ainu carry relatively high frequencies of DRB*1406, a variant originally thought to occur at high frequency among Native Americans and Northeast Asian peoples but not found in southern China6. Overall, the Ainu occupy an intermediate position between other East Asian populations and Native Americans. At a broader level, certain HLA studies have identified a migration route within East Asian populations that originated from northwestern China and diffused from north to south7; at least from an HLA perspective, both the Ainu and Tibetans belong overall to northern East Asians.
Furthermore, the discovery of a distinctive Helicobacter pylori strain in Okinawa, Japan, provides one among many lines of evidence. Two distinctive strain sub‑groups have been identified in Okinawa: the more recently diverged hspOkinawa, accounting for 14 %, and the more anciently diverged hpRyukyu, accounting for 16 %, with the remainder comprising the commonly East‑Asian hspEAsia. hpRyukyu, which accounts for 16 % of current strains in Okinawa and diverged 45 000 years ago, has its closest related strains in Afghanistan, Punjab (Pakistan) and Nepal, and studies infer its origin in Central Asia.
Through gene‑flow analysis, researchers have excluded the possibility that populations carrying this strain migrated to Okinawa via the southern coastal route, instead inferring that they took the northern route, bypassing the northern foothills of the Himalayas to reach East Asia8. The majority of Helicobacter pylori strains on the Japanese main islands are hspEAsia strains from the southern route. hspEAsia is widely distributed across China, South Korea, Vietnam, Thailand, Bhutan and other countries.
The paternal D1‑M174 departed from the eastern Mediterranean coast or near Central Asia toward the Far East approximately 45 000 years ago. Early international research placed the origin of D1‑M174 in Central Asia, an approach I consider accurate in its general direction, although one must also consider an earlier origin, since no DE‑M145* lineages are currently distributed in Central Asia. I suspect, however, that D1‑M174 may indeed have leaned more toward Central Asia than its sibling branches, being the only one to venture into the Far East, a behaviour that surely required some rationale, and leaning slightly toward Central Asia relative to other sibling branches is a reasonable one. If forced to select a single point of origin, my intuition leans toward somewhere on the eastern Mediterranean coast, but all of this requires future ancient DNA.
Before the Last Glacial Maximum, the homeland of the paternal D1a1‑F6251 may have been in the Altai region; after the LGM, the population as a whole shifted southward to the Gansu region, and after the Neolithic it began expanding eastward into the plains and southward into the Sichuan Basin. After D1‑M174 as a whole crossed the Altai region, the Japanese D1a2a‑M55 continued eastward. The high frequency of D‑M533 among Tibetans arises because D‑F6251 was itself an indigenous paternal lineage of the Gansu region, expanding into nearby areas; D‑M533 subsequently migrated onto the Qinghai‑Tibet Plateau in multiple waves, analogous to the situation in Japan.
Because D1‑M174 arrived relatively late, various populations had already spread across East Asia by the time of its arrival, so before the Last Glacial Maximum it rarely penetrated deep into the East Asian heartland, generally remaining at its periphery. Some branches did penetrate deeper, however: D1b‑L1378 appears to have attempted to enter Sundaland, yet judging from its geographic distribution it did not cross Wallace’s Line, reaching at most the Philippine archipelago in the east. There certainly also existed other D1‑M174* lineages that, due to small population sizes and technological stagnation in the late Palaeolithic, penetrated into the Far East and encountered misfortune through conflict with local populations, or briefly reached Indochina only to go extinct unexpectedly in later periods.
The Andaman branch of D1a2b‑Y34637 chose to migrate directly southward, crossing the Hengduan Mountains to reach Indochina, where it encountered certain K2b‑P331 branches. The M31a1 maternal haplogroup originally originated east of the Hengduan Mountains, then passed through Yunnan and Myanmar; by some coincidence, around 3 000–4 000 years ago it migrated together with D‑Y34637 toward the coast of the Malay Peninsula, and accompanied the Great Andamanese, carrying local K2b‑P331 and P paternal lineages, on their migration to the Andaman Islands. The M32a maternal haplogroup was originally present in the Malay Peninsula.
Analytical Model of Physical Morphological Change among East Asian Populations
From an archaeological perspective, although agriculture already existed in China 8 000–9 000 years ago, it was not yet a mainstream phenomenon, so at this stage R maternal lineages were still undergoing only tentative diffusion. By 6 000–7 000 years ago, however, they were diffusing vigorously and gradually admixing with local populations across various regions, accompanied by comprehensive transformations in physical morphology and culture.
Accordingly, the dramatic physical and technological transformations of prehistoric China were regarded by early physical anthropology as having occurred gradually between approximately 6 000 and 9 000 years ago, stabilising by around 4 000 years ago and persisting to the present. With the advent of molecular anthropology, the B and F/R9 branches represented by F1a1 have been shown to have begun diffusing across East Asia precisely around 10 000 years ago. According to research on the physical origins of the Han ethnicity by Zhao Dongyue (赵冬月) of Jilin University, after the Neolithic the Ancient Northwest China type gradually came to dominate China and progressively flowed southward and southwestward. The Ancient Northwest China type was primarily distributed in the Gansu‑Qinghai region; considering that its reference point is the Zongri culture, a clearly admixed population dating to 5 000 years ago, the Ancient Northwest China type can itself be regarded as an originally admixed type.
Among Neolithic populations, those closest to modern Han Chinese in descending order are the Ancient North China type, the Ancient Northwest China type, the Ancient Central Plains type and the Ancient South China type. Consequently, not only modern Han Chinese but also modern southern Chinese residents are more distant from pre‑Neolithic Ancient South China populations; indeed, following her line of reasoning, the ultimate conclusion would be that the ancestors of modern southern Han Chinese originally came from the north. Since the Ancient South China type has completely disappeared among modern southern Chinese populations, this means that the physical morphology of modern southern Chinese and pre‑Neolithic populations such as those represented by Liangdao 1 can be regarded as virtually two distinct populations. Therefore, both modern northern and southern Chinese have inherited, to the greatest extent, the prehistoric Ancient North China to Ancient Northwest China type.
By the Bronze and early Iron Ages, due to further population fusion, residents of the Ancient Northwest China type exhibited a marked increase in the nasomalar angle, signifying increased midfacial flatness and broader nasal morphology. This pattern of increasing facial flatness in later‑dated measurements also exists in Japan. Cranial features of the Jōmon people before the Edo period were typically more pronounced than those of modern Japanese; comparing crania from the 19th–early 20th century with those of contemporary Japanese reveals clear systematic morphological changes: modern Japanese crania are shorter and broader, exhibiting “brachycephalization”, that is, transverse cranial broadening, anteroposterior shortening, and relative changes in parietal curvature and cranial height9. The earlier crania are closer to the warrior‑type cranial features of Tibetans in the Kham region, while the later faces are flatter. In fact, Japanese crania, particularly before the Edo period, consistently retained substantial Jōmon characteristics.
Consequently, the facial projection of East Asians has not historically become progressively flatter or progressively more projected; rather, it has gradually converged toward a mixed state, populations with originally more projected faces became somewhat flatter, while those with originally flatter faces became somewhat more projected. Turning to Southeast Asians: judging from the situation in northeastern India, the Malay component can be modelled as an admixture of Tibeto‑Burman and AASI. The facial features of Malays can, in simple terms, be analogised to an admixture of Negrito‑like and Caucasoid‑like populations; precisely because the so‑called “Malay appearance” of Southeast Asia is the product of recent admixture, it combines modern human features with ineffably archaic characteristics. Furthermore, due to this recent admixture, Southeast Asians have darker skin than East Asians, while Melanesians, Indigenous Australians, and the indigenous populations of the Malay Peninsula and Andaman Islands, who have been almost unaffected by East Asian gene‑flow, retain near‑pure brown‑black skin and an archaic physical state.
Matrilineal Societies in Prehistoric East Asian Population Contacts
K2‑M526 paternal lineages, and K2b‑P331 in particular, should be regarded as the first human population to adopt patriarchy. Possibly due to their higher proportion of Neanderthal ancestry, they practised customs such as genocide, the killing of males while sparing females, and archaeologically attested human sacrifice, customs fairly common among Papuan Melanesians, Native Americans, and ancient Eastern European steppe populations. The specific causes underlying the formation of these customs remain unknown, and the influence of high Neanderthal ancestry is merely one possibility; what is indisputable, however, is that high Neanderthal ancestry correlates with K2‑M526 paternal populations in both ancient DNA and modern populations.
The distinctive feature of the Tianyuan Man is that his Neanderthal proportion was somewhat higher than that of modern humans, similar to Oase1 from Romania, dated to 42 000 years ago. Oase1 carried approximately 6–9 % Neanderthal ancestry, meaning that a pure Neanderthal ancestor existed in Oase1’s family line 4–6 generations previously10. This is also one of the characteristics of K2‑M526: as noted earlier, the world’s highest Neanderthal proportions are currently found among Papuan‑Australian populations with high K2b‑P331 frequencies, followed by East and Southeast Asia, and then Europe and the Near East, a ranking that also corresponds to the population base of K2‑M526 paternal lineages.
The key point, therefore, is that one cannot unthinkingly apply the historical model of the westward expansion of R‑M207 paternal lineages to the prehistoric processes of other regions, particularly East Asia. Early Neolithic China, particularly the north, belonged to a theocratic tribal alliance under the Great Mother Goddess cult; there is no evidence of the Indo‑European westward expansion pattern of village‑by‑village slaughter seen in early Europe, nor of the rigid caste‑based racial segregation system later introduced into South Asia. Consequently, for a population such as D1a1‑F6251, bound together by religion, the mentality of “shared faith makes one family” rendered indiscriminate killing inapplicable. Although class‑stratified feudalism with elaborate honorifics also prevailed within the D1‑M174 paternal lineage, it was not originally patriarchal in its early stages; moreover, the theocratic system offered many loopholes, such that the method of drawing groups into the alliance may have directly involved replacing the maternal lineages of the opposing upper and middle strata. This differed from the K2b‑P331 pattern of indiscriminate slaughter in prehistory, which is also why prehistoric Europe underwent paternal replacement while East Asia underwent maternal replacement.
D‑F849 diffused prehistorically from the northwest toward the east. In its tug‑of‑war with eastern populations, even when it gained short‑term advantages it could not shake the local foundations; under unfavourable conditions it reduced its own maternal lineages, while under favourable conditions it increased the maternal lineages of the opposing population. Upon retreating westward, it brought back new admixed autosomal populations combining native autosomal ancestry with eastern M‑lineage autosomal ancestry. The retreating populations inevitably brought back the admixed autosomal components acquired during the expansion; although the proportion of native ancestry declined, adaptation to the east simultaneously increased. When consistently outnumbered, direct admixture to acquire relative adaptability was preferable to continued isolation.
Consequently, in cold‑weapon conflicts with local indigenous populations, victory meant losing one’s already scarce tribesmen, while a single defeat meant retreating westward. The optimal solution was surely to draw surrounding tribes into the theocratic tribal alliance, achieving cultural and maternal diffusion while ensuring that the paternal lineage achieved a certain distribution among the local upper and middle strata. Before the onset of the Neolithic, O2a2b1‑M134, particularly its downstream branch O2a2b1a1a1‑F8, should have been the first indigenous branch encountered by D1a1a1‑F849 during its eastward expansion11. The two subsequently diffused together and early on developed reproductive advantages, representing the admixture between the populous eastern population and the western population. The D5’6 maternal haplogroup was likewise an eastern coastal lineage, although D5 diffused more successfully westward due to the westward expansion of the Yangshao culture; nevertheless, its frequency in the west remained markedly lower than in the east, and its branch diversity was inferior to that of the east, similar to D6.
Accordingly, during East Asia’s prehistoric civilisational transition, the pattern adopted was neither the R1b‑L151 genocide model of Europe, nor the mass expulsion seen in the Americas, nor the racial segregation system established by R1a‑Z93 in India. Instead, it was a theocratic tribal alliance that cooperated with the better‑adapted upper strata of local indigenous populations. Under relatively peaceful fusion, as long as a shared belief system existed and cultural customs such as language were changed, friendly development ensued. However, if the incoming population did not engage in large‑scale racial slaughter or segregation, its reproductive prospects would inevitably be unfavourable: early on it could maintain balance through religious belief, but later, in the face of overwhelming demographic disparity, faith could easily collapse and be overthrown. Moreover, from the perspective of historical development, the formation of broad‑territory states required, beyond clear division of labour, private property, cities and writing, the most critical element of patriarchy; before patriarchy emerged, human societies remained organised as loose theocratic confederations of tribes sharing common beliefs.
From historical, archaeological and modern perspectives, prehistoric D‑M174 populations maintained matrilineal social traditions, which were unfavourable to paternal transmission. Early northwestern Tibetan‑Qiang peoples have clear historical records of matrilineal society; the Japanese Jōmon period was unequivocally matrilineal, and armed conflict is rare within its global archaeological record. Among modern Chinese populations, the Mosuo are the only clearly matrilineal society, while the Pumi and Naxi only gradually transitioned toward patriarchy in recent times, coincidentally all carrying high frequencies of D1a1b‑P4712. Certain populations near the Himalayas still practise polyandry to this day; the origins of this polyandry differ from the artificial female infanticide practised by indigenous Indian populations such as the Toda to suppress the female population, and historical examples include the Eastern Women’s Kingdom of Danba, Garzê, Sichuan. Most branches, of course, have historically transitioned to patriarchy under the influence of surrounding K2‑M526 paternal populations. Among these, the first branch of D1a2a‑M55 to achieve massive population explosion was the Japanese imperial family lineage D1a2a1b2b1a1a‑CTS8093, which transitioned to patriarchy under the influence of O1b2‑P49 in the southern Korean Peninsula. All lineages that have achieved large‑scale diffusion, so far as can be determined, were the first to transition to patriarchy.
The almost purely O‑M134 Deng people unequivocally maintain an absolute patriarchal society and polygamous customs. A further distinction between the Deng and the Lhoba is that the former carry extremely low frequencies of A and F maternal haplogroups, with their maternal structure composed almost entirely of M9, D4, D5’6, M*, M12’G and Z, plus low‑frequency C and M11; the proportion of N‑rooted haplogroups such as A, B4 and F does not exceed 10 %13, far less than among the Lhoba and Tibetans. The Lhoba and Tibetans are brother populations sharing a common origin, with historical records of north‑to‑south migration14; both carry high frequencies of A and F maternal haplogroups in their maternal genetic structure, particularly F1c1a, with N‑rooted haplogroups exceeding 45 %, and they exhibit cultural differences from the Deng. This constitutes one among many indirect pieces of evidence for the correlation between F maternal haplogroups and D1a1‑P47 paternal lineages in Tibetan regions.
Haldane’s rule, proposed by J. B. S. Haldane, may also have been one of the factors in the extinction of the Neanderthals: during hybridisation with early modern humans, male offspring may have suffered early mortality or infertility. This rule explains not only numerous phenomena in the biological world but also cases of Y‑chromosome‑related asthenospermia in certain regions, essentially a consequence of admixture between incoming and local populations.
According to current research, incoming populations exhibit a further characteristic: males generally show a high proportion of spermatogenic dysfunction. The specific cause remains unknown, but I suspect it may relate to the fact that the population with the larger base during early admixture adapted more rapidly to the new autosomal background. The populations in southwestern China with a higher probability of spermatogenic dysfunction are those carrying minor paternal lineages including F*, K*, N1* and D1* (D1a1)15.
The pattern is equally pronounced among Japanese D1a2‑M55 carriers. Studies have demonstrated that spermatogenic dysfunction among Japanese D‑M55 and K* paternal carriers is far higher than in the normal group, while O2‑M122 carriers show the least spermatogenic dysfunction16. The same pattern exists among the Onge of the Andaman Islands, who are one of the world’s least fertile and most infertile peoples. Approximately 40 % of married couples are infertile; Onge women rarely become pregnant before the age of 28; and infant and child mortality stands at around 40 %17. All of these reflect the phenomenon whereby incoming males experience reduced fertility for a period following recent admixture.
The same situation appears among the Ainu. Early Western anthropologists such as Frederick Dickins observed, beyond the Ainu’s characteristic hirsuteness, that the Ainu exhibited admixture, later understood to be with the Nivkh people, and that the admixed descendants developed sparser body hair and typically became infertile after three or four generations18. I do not, of course, believe that complete infertility would ensue, but at the very least, according to Haldane’s rule, it is certain that male offspring would experience reduced fertility for a period thereafter.
The Accompanying Maternal Lineages of Basal Out‑of‑Africa Paternal Haplogroups
Among non‑R N maternal haplogroups that achieved population diffusion in China are A and N9: A is skewed toward the west, while N9 is skewed toward the northeast. In West Eurasia, the corresponding lineages are N1’5, N2 and X, whose geographic distributions are close to those of H, U, J and T. The high‑frequency N maternal haplogroups among Indigenous Australians include N13, N14, O and S, but their population base is low, possibly only a few hundred thousand. Similarly, the N8 maternal haplogroup was found in Iron Age northwestern Thailand, dated to 1 200–2 100 years ago, but has not been detected among modern indigenous populations of Indochina, the same situation as N10 and N11, all N‑lineage branches that failed to achieve large‑scale diffusion. In southern China and Southeast Asia, before the B’R11 and F/R9 maternal haplogroups achieved massive population growth, N maternal haplogroups were minor lineages, possibly accounting for less than 10 %.
Non‑F branches such as R9b, R9c and R11 have smaller population scales than A and N9, but still exceed those of N10 and N11 in Indochina. Before the large‑scale growth of R maternal haplogroups, the global population of N maternal lineages was substantially lower than that of M lineages, because in the absence of a complete technological advantage, the N lineage population, due to its early route choice, directly confronted Neanderthals, and the emergence of R maternal lineages in this process was a later development. Non‑R N maternal haplogroups account for a relatively small global proportion, approximately 5 %, of which the A maternal haplogroup, which accompanied R lineages, contributes nearly 40 %. In other words, had the downstream R maternal branches of N not undergone massive population explosion in later periods, the global population proportion of N maternal lineages, including their accompanying populations, would be far lower than that of M‑lineage populations today. It was only the extraordinary performance of the downstream R branches of N in later periods, as paternal populations gradually replaced their dominant maternal lineages with R lineages across Europe, Asia, the Americas and North Africa (north of the Sahara), that altered this balance.
Consequently, the greatest difference between M and N maternal haplogroups after their departure from Africa lies in the migration routes they initially chose. Both are the two major basal Out‑of‑Africa maternal lineages downstream of L3, but judging from modern geographic distribution, the main branches of M‑lineage populations initially chose routes that deviated from Neanderthal territory, migrating toward the Far East and the South Asian regions of the Iranian Plateau, whereas N‑lineage populations, with the former having already migrated eastward, were forced to continue northward and engage in a prolonged tug‑of‑war with Neanderthals. Judging from the current population sizes of N and M maternal lineages, the early N‑lineage population should have suffered substantial losses. This also explains why, in modern geographic distribution, the homeland of M maternal lineages lies in South Asia and Indochina, while that of N maternal lineages lies in the Arabian Peninsula, particularly the Levant. Subsequently, under the prehistoric condition of a stark population disparity between N and M lineages, the frequency of the downstream R branches of N reversed to surpass that of M lineages. Viewed from Europe–Near East and South Asia, R maternal lineages integrated relatively easily into M‑lineage populations, whereas M lineages found it harder to integrate into R‑lineage populations, which may also explain why ancient M‑lineage individuals have been detected in prehistoric Europe but left no large‑scale descendants, whereas the situation in South Asia differed.
Apart from the M1 maternal haplogroup, some recent exchanges between India and Northeast Africa, and the Austronesian diffusion to Madagascar, M maternal haplogroups have had almost no impact on Africa. The M maternal lineages of Madagascar and the Seychelles Islands in southeastern Africa, including M7c, are, as noted earlier, pure downstream branches brought by Austronesian populations, exhibiting region‑specific distribution and a history of no more than 2 000 years.
R maternal haplogroups, by contrast, are the largest maternal lineage in northern Africa, a pattern confirmed archaeologically as well. N and R maternal haplogroups have numerous branches in Africa; they are the dominant lineages north of the Sahara, while south of the Sahara they have been detected in many ancient DNA samples as civilisation transmitters. The M1 maternal haplogroup belongs to M1’20’51, and M1’20’51* together with M20 and M51 constitute the dominant maternal lineages of the Wa people. Early molecular anthropology assigned M1’20’51, M12’G and M80’D collectively to the M‑b downstream cluster, but subsequent research found their connections to be weak; nevertheless, this at least indirectly indicates that the three are more closely related to each other than to other branches.
In terms of age, the coalescent age of M1 maternal lineages within Africa is younger than that of M1 lineages in the Near East–South Asia region, and large numbers of M1* maternal lineages have been found in northwestern Africa and the Near East rather than in East Africa19. Geographically, M1 and U6 maternal haplogroups may also have diffused synchronously, having been detected in other Mediterranean regions and Sicily, and the Eurasian origin of U6 has been definitively confirmed. Consequently, the initial expansion of M1 maternal lineages in Africa occurred in the northwest rather than the east, with the Near East most likely serving as the origin point of the original M1 diffusion, westward into Africa and eastward into Central Asia. Setting aside the vast difference in diversity, the origin age of M1 maternal lineages within Africa is approximately 48 000 years, while that of M maternal lineages in South Asia is around 56 000 years20, and some studies suggest that M1 originated in India 32 000 years ago and was introduced to East Africa by sea.
According to currently published ancient DNA data, F‑M89 paternal samples of substantial antiquity include two M‑lineage individuals dated to 43 000 years ago carrying F‑Y27277 (AA7‑738, F6‑620)21; two N‑lineage individuals dated to 45 000 years ago carrying K2a*‑FTH1 (RNI013, RNI010); Ust’‑Ishim, dated to 45 000 years ago, carrying K‑M2308 and R maternal lineage; Oase1, dated to 38 000 years ago, carrying K‑M2308 and N maternal lineage; and the famous Tianyuan Man from Zhoukoudian, Beijing, dated to 41 000 years ago, carrying K2b‑P331 and B4’5 maternal lineage.
The Tianyuan Man carried an extinct B maternal lineage and was already regarded by the physical anthropology era as exhibiting admixed features, a conclusion confirmed by autosomal analysis of modern genetic DNA data. The Tianyuan Man can be modelled as 60 % Onge‑related (Andaman) component and 40 % early human East Eurasian component related to migration into Siberia, the latter sharing distant affinities with the BK Cave individuals of Bulgaria, precisely indicating that the paternal and maternal lineages of the Tianyuan Man may have had different origins.
Furthermore, the Tianyuan Man shares greater affinities with the 35 000‑year‑old Belgian ancient individual GoyetQ116‑1, carrying C1a2‑V20 paternal and M32’56 maternal lineages. Oase1, CC7‑335 and F6‑620 likewise share affinities with the Tianyuan Man while differing markedly from Kostenki14, the latter being closer to Europeans together with BK1653, which carries K2a paternal and U8 maternal lineages22. The significance of Tianyuan therefore lies in demonstrating that the admixture history of East Asia did not begin only in the Neolithic, but had already begun sporadically at least 40 000 years ago. Judging from femoral indices, the Tianyuan Man may have resembled populations near the equator, such as those of Melanesia and Indonesia23.
CC7‑335, dated to 45 000 years ago, carries C‑F1370 paternal and N maternal lineages. BB7‑240, dated to 45 000 years ago, carries C‑F3393 paternal and N maternal lineages. GoyetQ116‑1, dated to 35 000 years ago, carries C1a2‑V20 paternal and M32’56 maternal lineages. GoyetQ376‑3 carries C‑M130 paternal and M74 maternal lineages. Kostenki12, dated to 33 000 years ago, carries C‑Y37006 paternal and U2 maternal lineages. FRL006, dated to 29 000 years ago, carries C1a2‑V20 paternal and M5 maternal lineages. The shared characteristic of all these samples, with the exception of Kostenki12, is that their Onge‑related component is not low.
Mesolithic hunter‑gatherers from Sri Lanka, recovered from the Udupiyangalge and Alugalge caves, yielded M18a and M35a maternal lineages dated to before 5 500 years ago24. M18a is currently distributed among modern Sinhalese, whose paternal pool is dominated by F‑M89, H, L, J and R2a25, as well as Sri Lankan Tamils and Sri Lankan Indian Tamils. The M35a lineage has been observed in all Sri Lankan populations, reaching high frequency among the Sinhalese, who additionally carry M45, M5a2a, M6a1a, M30b, M37, M65a, M30, M18’38, M30c, M37e, M30b, M65a, M35a1, M64, M65a, M2a1, M3c, M52a and M53.
Sri Lanka has been inhabited since 48 000 years ago, and 24 skeletons have been excavated and genetically tested, but no paternal or maternal data have been published to date26. South Asia has long been a blank spot for ancient DNA data; the earliest known modern human remains in India are in Sri Lanka, centred on the Late Pleistocene Balangoda Man, with nearby Fa Hien Cave yielding human remains dated to 38 000 years ago, Belilena Cave yielding ten humans dated to 32 000 years ago, and Batadombalena likewise yielding ancient human remains.
The paternal and maternal lineages of modern Sri Lankan populations differ very little from those of the Indian mainland, after all, the two lost contact only due to sea‑level rise after the Last Glacial Maximum, but prehistorically they should have maintained direct population exchange. For instance, the maternal similarity between Sri Lankan Tamils and Indian Tamils is high, differing only in that the latter carry M53, M65b and M35b while the former do not, and the former carry M34a, M35a and M38a while the latter do not. Consequently, the fact that India’s earliest remains are found in Sri Lanka does not affect the overall assessment of Indian ancient DNA data.
Other regions such as Oceania and the Indonesian archipelago belong to the South Pacific plate, where preservation conditions are unfavourable; currently only a few meaningless samples dating to a few hundred years ago exist, and further testing has not been actively pursued. It is possible that the very few samples that have been tested will, like those from Indochina, remain unpublished for the time being. In Australia, early precious human remains were reburied by local Indigenous populations, rendering effective DNA recovery impossible. Nevertheless, two crania of Wajak 1, dated to 28 000–37 000 years ago and classified as proto‑Australian, have been excavated in Tulungagung Regency, East Java, Indonesia, and can be compared with Indian ancient samples.
From the perspective of current ancient DNA data, the downstream DE‑M145 of the Out‑of‑Africa paternal CT‑M168 currently has no samples older than 30 000 years; among these, D1‑M174 has no samples even older than 10 000 years. Future data from the Okinawan Shimotabaru people may break this record, but nothing has been published as yet. By contrast, early samples of CF‑P143 exhibit a mixed N and M maternal profile. Judging from modern geographic distribution, the regions inhabited by E‑M96 and D2‑FT75 paternal lineages do not display the extreme M‑lineage diversity characteristic of the South Asian subcontinent, Indochina and the Malay Archipelago.
According to modern DNA data, the M maternal haplogroups currently known in South Asia include M2, M3, M4, M5, M6, M18, M30, M31, M32, M33, M34, M35, M36, M37, M38, M39, M40, M41, M47 (sharing markers with M42), M43, M44, M45, M49, M52, M53, M54, M56, M57, M58, M60, M63, M64, M65, M66, M67, M78, M81, M84, M86 (M42’74, M4’67)27 and their sister downstream branches.
A second diversity hotspot of M maternal haplogroups, Indochina, includes M12, M13, M20, M51, M61, M16, M17, M19, M21, M22, M75, M24, M26, M48, M74, M71, M72, M73, M79, M76, M82, M83, M91, M68, M69, M50, M55, M77, M59 and their sister downstream branches. New Guinea includes M25, M27, M28, M29, Q and M29; Australia includes M14, M15, M29’Q and M42. Additionally, M62 and M70 currently exist only on the Qinghai‑Tibet Plateau; ancient DNA for the former includes paternal D‑BY12979, O‑MF10037 and N‑CTS4714, while all currently available ancient DNA for the latter has been detected in paternal N1‑F963 individuals.
If one excludes the L maternal haplogroups, predominantly non‑L3, introduced into sub‑Saharan Africa by the Bantu expansion over the past few millennia, the remaining distribution regions of the E‑M96 paternal lineage, apart from M1, are almost entirely downstream N maternal haplogroups, while E‑M89* has been detected in the Arabian Peninsula and the Levant. The Vedda of South Asia, the Lahu of East Asia, and the indigenous populations of the Malay Peninsula and western Indonesia in Southeast Asia, all with high CF‑P143 frequencies, carry M maternal haplogroups that are both high‑frequency and rich in diversity, and the earliest ancient DNA of West Eurasia likewise includes M maternal lineages. E‑M96 in India is distributed only at low frequency among Indian Shia Muslims and concentrated in the E1b1b branch, and has not been detected in any South Asian marginal tribal population since the development of molecular anthropology28.
The origin of the YAP insertion mutation in DE is currently highly contested, with competing hypotheses of a Northeast African origin and a Eurasian origin. D2‑FT75, the sister branch of D1‑M174, is distributed at extremely low frequency in the Arabian Peninsula and West Africa, while the remaining DE‑M145* lineages are currently scattered around the eastern Mediterranean. Root branches, that is, branches that diverged simultaneously but, due to limited diffusion, may have retained more original geographic locations, are precisely the branches that warrant particular reference.
The downstream U and H of R maternal haplogroups in South Asia, as well as B and F maternal haplogroups in East and Southeast Asia, all show clear traces of recent diffusion. Moreover, the global distribution of N and R maternal haplogroups is clearly more western‑skewed and later in departing Africa than that of M lineages; correspondingly, the paternal lineage that is more western‑skewed and later in departing Africa than CF‑P143 is DE‑M145. The main branches of N and R maternal haplogroups have been distributed in the Near East from antiquity to the present, so only a small portion of N and R branches accompanied unknown populations to the Far East in prehistory. The migration of E‑M96 paternal lineages into sub‑Saharan Africa did not accompany M‑lineage diffusion because DE‑M145 paternal lineages originally accompanied N maternal lineages.
Clearly, however, after departing Africa, CF‑P143 paternal lineages, apart from branches that never left South Asia, encountered N‑lineage populations significantly earlier and on a larger scale. DE‑M145 may also have encountered some M‑lineage populations in later periods, but judging from modern geographic distribution and ancient DNA data, the scale was not as large as the former. In terms of population size, the prehistoric Out‑of‑Africa N and M maternal populations, due to their different route choices, faced different predicaments, resulting in massive population disparities. As noted earlier, before the later massive explosion of its downstream R lineages, the N‑lineage population was relatively small compared with the M‑lineage population. This is also one among many indirect pieces of evidence for the prehistoric association between M maternal lineages and F‑M89: after all, the prehistoric population size of F‑M89 paternal lineages presumably exceeded that of the other three major basal Out‑of‑Africa paternal lineages, and if paternal population sizes cannot be matched with maternal population sizes, such spontaneous reproduction is clearly unreasonable.
Consequently, the branch diversity of M maternal haplogroups is concentrated in the South Asia–Indochina region. It can be said that for a long time after humans departed Africa, apart from the Near East, North Africa and Australia, M maternal lineages dominated exclusively outside Africa. Although Australia carries M14, M15, M29’Q and M42, it was also one of the few regions where N maternal lineages exceeded M lineages before the arrival of P lineages. This is precisely why R maternal lineages appear so anomalous: had R lineages not diffused in later periods, under the condition of almost pure L lineages in sub‑Saharan Africa, M lineages would have dominated exclusively outside Africa apart from certain regions.
Between 50 000 and 60 000 years ago, the activity range of DE‑M145 should have encompassed all of North Africa, Northeast Africa and the vicinity of the eastern Mediterranean coast. As noted earlier, D1‑M174 more likely originated in northern Arabia near Central Asia, ultimately departing from the vicinity of Central Asia toward the Far East, while D2‑FT75 remained in the Arabian Peninsula with some lineages retreating to Northwest Africa. I personally disagree with the early view that F‑M89 diverged in South Asia, because this cannot explain the equally early appearance of certain F‑M89 branches in the Near East. One cannot focus solely on the fact that many minor F‑M89 sub‑branches have been found in South Asia; I personally lean toward the view that CF‑P143 began diverging near the Iranian Plateau, with the main branches diffusing toward the Far East and South Asia, while some branches such as G and J, typical Caucasian paternal lineages, refluxed to southeastern Europe. Considering the modern geographic distribution, CF‑P143 clearly did not migrate entirely to South Asia: some may have remained near West Asia and later refluxed to Europe, such as C1a‑V20 and G, I, J paternal lineages, while some may have migrated directly northward into Siberia, such as K2 paternal lineages.
A reasonable inference is therefore that during the Out‑of‑Africa period 50 000–60 000 years ago, DE‑M145* paternal lineages were distributed roughly across North Africa–Northwest Africa–the Levant. This distribution not only provided space for retreat into Africa and sub‑Saharan Africa, but also explains the current circum‑Mediterranean and Near Eastern distribution of DE‑M145*: some E1b1b‑M35 migrated to the Balkans, and the more southerly, Caucasus‑distributed D1‑M174 likewise had sufficient space and reason to migrate toward the Far East. CF‑P143* paternal lineages were distributed roughly across the Iranian Plateau–northwestern South Asia and parts of the northern Arabian Peninsula periphery, which explains the subsequent migration of the main F‑M89* branches toward South Asia, the reflux of some G, H, I, J, K branches to southeastern Europe, and the direct northern route taken by some branches into Siberia.
Finally, over the course of 50 000–60 000 years, a stable early anatomically modern human population gradually emerged on the eastern Mediterranean coast. D1‑M174 inherited a portion of N and R maternal lineages from this population and began migrating eastward 45 000 years ago. Which other CT‑M168* paternal populations were included in this population’s range, and which paternal lineages that migrated toward the Far East carrying R maternal lineages have since gone extinct, can no longer be verified. Nor can the initial mechanism by which D1‑M174 inherited these lineages, whether it carried them from its origin or acquired them through exchange with other CT‑M168* populations, be verified. The only assertion I can make with certainty is that D1‑M174 had already acquired this portion of autosomal ancestry before departing for the Far East. Some anthropologists, aware of the above information, might refer to D1‑M174 as “proto‑Caucasoid”.
Future Prospects for Ancient Samples and Potential Data
The current conclusions are merely indirect inferences drawn from available data. Whether the model’s accuracy can be proven requires more direct ancient DNA evidence; until more direct evidence is obtained, everything remains merely one hypothesis among many models, albeit a hypothesis that may fit the data within a certain framework, but not necessarily one that fully corresponds to reality.
Currently, ancient samples from southwestern China dating to over 10 000 years ago and exhibiting comprehensive backwardness in physical morphology, technology and culture involve only female individuals, with no male paternal samples. The Maludong Site (马鹿洞遗址) in Yunnan has yielded dozens of human skeletal fragments, which scholars currently recognise as belonging to at least five distinct individuals, yet only one female sample has been published. Liangdao 1 (亮岛 1 号) from the southeastern coast was initially delayed in publication, while the male individual from Qihe Cave (奇和洞), whose physical morphology and cultural customs resemble those of Liangdao 1, remains unpublished to this day. One must also consider the DNA preservation conditions of human remains in different regions: for example, the Gaoshan Ancient City Site (高山古城遗址) in Chengdu yielded 116 skeletal samples, yet due to poor preservation only three were ultimately published. Among these, the female sample carried M9a1a, while the male samples D‑Z31591 and O‑Z25915 have paternal data but no maternal data, a highly anomalous situation, since mitochondrial DNA is generally easier to recover than the Y chromosome.
The Lajia Site (喇家遗址) of the Qijia Culture is currently the only site in northwestern China where early D1a1a1a1a1‑F729 paternal lineages are accompanied by both ancient DNA data and physical anthropological data. Previous craniometric studies of the Lajia Site concluded that its crania differ from those of other Gansu‑Qinghai regions: the craniometric data of Lajia approach “Caucasoid” morphology. In terms of facial flatness, the nasomalar angle of 141° is small, indicating a highly projected face, falling within the variation range of “South Asian Mongoloid”; the frontal inclination angle of 89° indicates a straight forehead; and the cranial height of 147 mm indicates a very high‑vaulted cranium 29, differing substantially from the medium‑to‑large nasomalar angles of other ancient inhabitants of the Gansu‑Qinghai region.
However, the study also notes that no Caucasoid genetic traces were found. In fact, this so‑called “Caucasoid” is an outdated anthropological term broadly referring to populations whose cranial morphology is Caucasoid‑like and who are distributed across the Near East–Europe–North Africa. The paper’s authors were unable to explain these data because they lacked rigorous molecular anthropology knowledge. The Qijia Culture, after all, represents an already fully admixed early Tibeto‑Burman population, offering limited reference value for the early morphology and autosomal ancestry of D‑Z27269. The Qijia Culture and Yunnan Bronze Age sites are relatively late, but they at least demonstrate that D‑Z27269, from an autosomal perspective, arrived from the northwest in later periods.
At the modern genetic level, populations such as the Khampa (康巴), Hei Yi (黑彝), Gyalrong (嘉绒) and Western Sichuan Qiang (川西羌), who carry relatively high frequencies of D1a1‑P47 and low frequencies of D1a1‑Z27269, are very similar to the Longxi (陇西) Yangshao component in genetic ancestry estimation programs. The Han Dynasty Qiang (汉代羌人) and the Lajia Site likewise exhibit strong western Yangshao characteristics. The vast majority of Tibeto‑Burman populations have autosomal ancestry that is even more northern‑shifted than that of northern Han Chinese, although among the Yi, only the Hei Yi, with its higher frequency of D‑Z31591, fits this pattern, whereas the Bai Yi (白彝) does not.
Regarding the earliest ancient DNA data for D‑M174, the earliest ancient sample of D1a1‑F6251 currently available comes from D‑F17412, a downstream branch of D‑F729, detected at the Wangjiayinwa Site (王家阴洼遗址) in Tianshui, Gansu, dated to 5 750 ± 200 years ago and located only a few kilometres from the Dadiwan Site (大地湾遗址). The Wangjiayinwa Site, together with the Dadiwan, Xishanping (西山坪遗址) and Shizhaocun (师赵村遗址) sites, belongs to the radiation zone of the early Dadiwan Culture. The A25 maternal haplogroup of this sample later appeared at the Shuanghuaishu Site (双槐树遗址) and the Shimao Site (石峁遗址), both of which are important early sites associated with the divergence of the Proto‑Sino‑Tibetan population into Sinitic populations. The earliest ancient sample of D1a2a‑M55 comes from the Iyai Site (伊亚伊岩棚遗址) in Gunma Prefecture, Kantō, Japan, an individual dated to 7 544 ± 26 years ago, carrying paternal D‑Z1513 and maternal N9b. This is currently the earliest definitively dated sample of the entire D1‑M174 lineage.
As is well known, the Yangshao Culture is divided into early, middle and late phases, but there also exists a pre‑Yangshao period, namely Phase I of the Dadiwan Culture, which is the culture most likely to yield high‑frequency and well‑dated D1a1‑F6251 samples. The first phase of Dadiwan, dated to 7800–7300 BCE, is termed the pre‑Yangshao period, yet samples from this period at Dadiwan are currently completely blank, with only middle‑to‑late phase samples available. Later, already‑admixed sites include the Baijiacun Site (白家村遗址), Xishanping Site and Shizhaocun Site. The Yangshao Culture includes the Banpo Site (半坡遗址), Jiangzhai Site (姜寨遗址), Beishouling Site (北首岭遗址), Xipo Site (西坡遗址) and Nanzuo Site (南佐遗址). The later Majiayao Culture (马家窑文化), Zongri Culture (宗日文化), Baodun Culture (宝墩文化), Qijia Culture, Siba Culture (四坝文化), Xindian Culture (辛店文化) and Shi’erqiao Culture (十二桥文化) should theoretically all yield detectable frequencies of D1a1‑Z27269.
The Daxi Culture (大溪文化), dated to 6 000 years ago, should contain O1b1‑M95, O2a‑M7 and downstream branches of D‑F1070 such as D‑Z41207, as well as certain southern‑skewed B and F/R9 branches. The predecessor of the Daxi Culture was the Chengbeixi Culture (城背溪文化) in Hubei, whose predecessor was the Pengtoushan Culture (彭头山文化) dated to 9 000 years ago, the first Neolithic culture in the middle Yangtze River with definitive evidence of artificial rice cultivation. As the Daxi Culture expanded southeastward, Austronesian and Austroasiatic populations withdrew from southern China. The descendants of the Daxi Culture primarily participated in the formation of Kra‑Dai, Hmong‑Mien and southern Han Chinese populations, so ancient samples of D‑F1070 can be hoped for from various sites in the middle and upper Yangtze River.
These are all Neolithic samples, however, offering limited reference value for early morphology. Tracing further back into prehistory, the Shuidonggou Site (水洞沟遗址) in Lingwu, Ningxia Hui Autonomous Region, serves as a candidate, but no human remains have yet been discovered at this site. Theoretically, the northeastern edge of the Qinghai‑Tibet Plateau, the Japanese archipelago including surrounding seabeds, and the Kamchatka region all have the potential to yield D1‑M174 ancient samples dated to 10 000 or even 30 000 years ago; to reach 45 000 years or older, future discoveries will depend on luck in the eastern Mediterranean coast, West Asian countries, or the Central Asian Caucasus region.
Currently, the most promising candidates are the 27 000‑year‑old Okinawan Shimotabaru People in Japan, and in China, the two Wushan Man (武山人) individuals from the Langjiaowa Site (狼叫屲遗址) in Wushan County, Tianshui, Gansu, dated to 38 000 years ago, comprising a fragmentary male cranium of approximately 20 years of age and a complete female cranium of approximately 35 years of age. The possibility remains real given this location, after all, the prehistoric homeland of D1a1‑F6251 lay in the vicinity of Tianshui, Gansu. Second is the Jingchuan Man (泾川人) from the Niujiaogou Site (牛角沟遗址) in Jingchuan County, Pingliang, Gansu, dated to 20 000–50 000 years ago, which yielded a male cranium of approximately 20 years of age, accompanied by an external occipital protuberance characteristic common in contemporaneous European human fossils but rare in East Asia. Compared with the contemporaneous Wushan Man cranium, the two may represent “sister groups” sharing a common ancestor.
References
[1] 文波,石宏,任玲,等. Y 染色体、线粒体 DNA 多态性与云南宁蒗摩梭人的族源研究 [J]. 中国科学 (C 辑), 2003, 33 (4): 375-384.
[2] Stewart J B, Chinnery P F. The dynamics of mitochondrial DNA heteroplasmy: implications for human health and disease[J]. Nature Reviews Genetics, 2015, 16(9): 530-542.
[3] Di D, Sanchez-Mazas A, Currat M. Computer simulation of human leukocyte antigen genes supports two main routes of colonization by human populations in East Asia[J]. BMC Evolutionary Biology, 2015, 15:240.
[4] Li D N, Li H, Ou C Y, et al. Paternal Genetic Structure of Hainan Aborigines Isolated at the Entrance to East Asia[J]. PLoS ONE, 2008, 3(5): e2168.
[5] He G L, Wang Z Y, Jiang Y T, et al. Complex peopling history and expansion events inferred from large-scale modern and ancient Y chromosome sequences[J]. Science Advances, 2026, 12(14): eadu7935.
[6] Bannai M, Tokunaga K, Imanishi T, et al. HLA class II alleles in Ainu living in Hidaka District, Hokkaido, Northern Japan[J]. American Journal of Physical Anthropology, 1996, 101(1): 1-9.
[7] Di D, Sanchez-Mazas A. Challenging Views on the Peopling History of East Asia: The Story According to HLA Markers[J]. American Journal of Physical Anthropology, 2011, 145(3):351-364.
[8] Suzuki R, Saitou N, Matsuari O, et al. Helicobacter pylori genomes reveal Paleolithic human migration to the east end of Asia[J]. iScience, 2022, 25(7): 104477.
[9] Usui S, et al. Secular Changes in Cranial Morphology and Pattern of Sexual Dimorphism in Modern Japanese: A Geometric Morphometric Analysis Using Post-Mortem Computed Tomography Data[J]. American Journal of Physical Anthropology, 2026, 189(3): e70235.
[10] Fu Q, Hajdinjak M, Moldovan O T, et al. An early modern human from Romania with a recent Neanderthal ancestor[J]. Nature, 2015, 524(7564): 216-219.
[11] Wang L X, Lu Y, Zhang C, et al. Reconstruction of Y-chromosome phylogeny reveals two neolithic expansions of Tibeto-Burman populations[J]. Molecular Genetics and Genomics, 2018, 293(5): 1293-1300.
[12] 谢选华,李辉,毛显云,等。从 Y 染色体遗传结构看藏缅语族人群的起源 [J]. 遗传学报,2004, 31 (10): 1023–1029.
[13] 毛乙臻,王飞,刘雨佳,等。线粒体 DNA 基因组揭示的白马人群的遗传结构 [J]. 中国科学:生命科学,2025, 55 (1): 153-167.
[14] 廖小韵,郝晓光,胡小刚,等. 藏南地名佐证门巴与珞巴的民族归属[J]. 地理空间信息,2011, 9(2): 136‑138.
[15] 冉静,丁显平,等. Y 染色体单倍群与西南地区男性生精障碍的相关性 [J]. 遗传,2013, 35 (1):75-80.
[16] Sato Y, Shinka T, Iwamoto T, et al. Y Chromosome Haplogroup D2* Lineage Is Associated with Azoospermia in Japanese Males[J]. Biology of Reproduction, 2013, 88(4): 107.
[17] Sharma A N. Tribal Development Andaman Islands[M]. New Delhi: Sarup & Sons, 2003: 64.
[18] Dickins F V. Aino hairiness and the Urvolk of Japan[J]. Nature, 1887, 35: 534.
[19] González A M, Larruga J M, Maca-Meyer N, et al. Mitochondrial lineage M1 traces an early human backflow to Africa[J]. BMC Evolutionary Biology, 2007, 7(1): 123.
[20] Roychoudhury S, Roy S, Basu A, et al. Genomic structures and population histories of linguistically distinct tribal groups of India[J]. Human Genetics, 2001, 109(3): 339-350.
[21] Hublin J J, Sirakov N, Aldeias V, et al. Initial Upper Palaeolithic Homo sapiens from Bacho Kiro Cave, Bulgaria[J]. Nature, 2020, 581(7808): 299-302.
[22] Hajdinjak M, Mafessoni F, Skov L, et al. Initial Upper Palaeolithic humans in Europe had recent Neanderthal ancestry[J]. Nature, 2021, 592(7853): 253-257.
[23] Shuangquan; Chen, Fuyou; Trinkaus, Erik (17 April 2007). "An early modern human from Tianyuan Cave, Zhoukoudian, China" &. Proceedings of the National Academy of Sciences. 104 (16): 6573-6578.
[24] Fernando A S, Wanninayaka A, Dewage D, et al. The mitochondrial genomes of two Pre-historic Hunter Gatherers in Sri Lanka[J]. Journal of Human Genetics, 2023, 68(2): 103-111.
[25] Urban Aragon J A, Bandyopadhyay E, Ranasinghe R, et al. Population histories of the Indigenous Adivasi and Sinhalese from Sri Lanka using whole genomes[J]. Current Biology, 2025, 35(12): 2745-2754.e5.
[26] Bourgon N, Oelze M, Amano N, et al. Pre-agricultural intensification of plant use in Pleistocene Sri Lankan rainforests[J]. Nature Ecology & Evolution, 2026.
[27] Chandrasekar A, Kumar S, Sreenath J, et al. Updating Phylogeny of Mitochondrial DNA Macrohaplogroup M in India: Dispersal of Modern Human in South Asian Corridor[J]. PLoS One, 2009, 4(10): e7447.
[28] Zhao Z, Khan F, Borkar M, et al. Presence of three different paternal lineages among North Indians: A study of 560 Y chromosomes[J]. Annals of Human Biology, 2009, 36(1): 46-59.
[29] 王明辉.青海民和喇家遗址出土人骨研究 [J]. 北方文物,2017 (4): 25-30.
[30] Sato Y, Shinka T, Iwamoto T, et al. Y chromosome haplogroup D2a1 is significantly associated with high levels of luteinizing hormone in Japanese men[J]. Andrology, 2015, 3(4): 520–525.
[31] Mao X W, Zhang H C, Qiao S Y, et al. The deep population history of northern East Asia from the Late Pleistocene to the Holocene[J]. Cell, 2021, 184(12): 3202-3213.e13.
Appendix
The Original Pronunciation and Phonetics of the Qiang
The original pronunciation of Qiang has in fact reached a consensus in linguistics. All mainstream reconstruction systems agree that the initial consonant is reconstructed as the velar aspirated stop kʰ, where kʰ (kh) is a velar aspirated stop produced by a velar plosion accompanied by a strong burst of air, auditorily resembling the forceful expulsion of a cough. Current controversy over the reconstruction concerns only whether the syllable contained a liquid consonant ‑l‑ in a consonant cluster, and how to handle possible prefixed implicit consonants. This is why some systems do not adopt the *kʰl‑ cluster, reconstructing it as *kʰaŋ (kang), while another school reconstructs it as *kʰlaŋ (klang). In subsequent historical phonetic evolution, this sound lost its plosive quality and simplified to the fricative h, and also lost its aspiration to become the unaspirated k. Regarding its origin, a minority view holds that it derives from the Tocharian word klānk, meaning “chariot warrior”.
Personally, however, I am not particularly interested in linguistic reconstruction or its semantic implications, nor is my foundation in this field solid. As an independent anthropology researcher, my concern lies more with the question of why it was initially pronounced with a “k” sound but later evolved into a “q” sound. I believe this question has never been adequately resolved, and no one has truly approached it from an anthropological rather than linguistic perspective. In fact, this phenomenon is quite common in modern Chinese: Cupido was transliterated as Qiūbǐtè (丘比特) after entering China, with the initial k replaced by q. The original pronunciation of Qiūjiùquè (丘就却) was Kujula, and like Cupido, the k was transformed into q after transmission. Similarly, jūn (君) was originally pronounced kun but is now jun; qì (气) was originally ki but is now qi. There is also the case where g ultimately transforms into j: for example, jiā (家) was originally pronounced gia but is now jia; jiàn (见) was originally kian but is now jian.
Similar phenomena are actually quite common in reality, such as the accents of various regional dialects. In extreme cases, some accents give the impression of forcing pronunciation forward, with the result that the entire sound is compressed to the very front of the mouth, and the centre of gravity of the tongue also shifts forward. The most common characteristic is the failure to distinguish between retroflex and non‑retroflex sibilants, with retroflex sounds transformed into non‑retroflex sibilants. Because the tongue position is forward during articulation, it is simply impossible to produce the retroflex sounds of standard Mandarin, which require a more retracted tongue position. This pattern manifests in different accent forms across regions, but the core rule is the pronunciation of zh/ch/sh as something resembling z/c/s: for example, zhīchí (支持) is pronounced zīcí (资瓷), lǎoshī (老师) as lǎosī (老丝), chīfàn (吃饭) as cīfàn (呲饭), and zhū (猪) as jū (居). Similar examples need not be enumerated further.
We therefore find two patterns of pronunciation issues that appear to share the same underlying mechanism. The first, most obviously, causes the entire articulation to be compressed forward during speech, a phonetic fronting at the level of phonetic realisation. Its characteristic is that certain velar sounds, such as k, are articulated from the velum toward the hard palate; the phoneme remains the same, but its actual realisation is more forward, with velar sounds as a whole shifting toward the palatal region, creating an overall auditory effect of being “sharper and more compressed”. Dialects in certain regions carry this fronting tendency, which involves place fronting without palatalisation, resulting in an overall auditory quality concentrated in the anterior oral cavity. If a dialect consistently favours anterior tongue positions over a long period, then ultimately not only will k and g sounds front, but fricatives and the resonance positions of vowels will also shift anteriorly, which is why some dialects give the impression of being “very compressed”, particularly in certain regions.
The second pattern directly transforms velar sounds such as k and g into q and j. This pronunciation rule is a direct substitution at the phonemic level, known technically as Velar Palatalization. The mainstream definition is: “a phonetic process usually driven by the high tongue position of front vowels, which causes articulations originally produced at the velum to move forward to the hard palate.” This results in velar stops such as k and g frequently transforming into postalveolar affricates /tʃ/and/dʒ/. This velar palatalization phenomenon is actually more widespread than we imagine: for example, in Old Chinese, the initial consonants of characters such as sān (三), sì (四), wǔ (五), liù (六), qī (七) and jiǔ (九) all belonged to the k/g velar series, with articulation deep in the throat. By the Yuan and Ming dynasties, these velar sounds had generally undergone fronting, that is, velar palatalization, with k/g gradually becoming q/j and other more anterior sounds, making overall pronunciation increasingly forward. This is one of the core phonetic change rules in Chinese over several millennia.
Some dialects exhibit even more extreme velar palatalization, shifting originally velar sounds to the alveolar position, with all articulation concentrated in the anterior half of the oral cavity. The auditory impression is thus that of speaking with the tongue curled, producing a flat, non‑resonant voice. Its principle is entirely consistent with the phonetic change rules described above, the core being anterior shift of articulation place and the failure of the articulatory organs to exert full force. Interestingly, it is precisely some southern regions and modern Japanese that have inherited Middle Chinese pronunciation. For example, Japanese and modern Chinese exhibit inverse patterns: the general pronunciation rule in Japanese is that j and q sounds are pronounced as k. For instance, the consonant of “Han” (汉) is j, but in Japanese it transforms to k; jūn (君) is pronounced kun in Japanese, and jiā (家) as ka. This is the same principle as some regions transforming pinyin j into g, such as pronouncing jiě (解) as gai.
Modern linguistics explains this velar palatalization phenomenon as a historical process in which ancient people, in order to reduce tongue muscle effort and achieve smoother articulation, gradually abandoned velar pronunciation over the course of evolution. This logic, however, clearly does not withstand scrutiny. If the sole motivation were effort reduction, then populations across all cultures, periods and regions should exhibit a comparable proportion of palatalization. Yet many modern languages have not undergone palatalization at all; the phenomenon exists only in certain regions. If a law of effort reduction were at work, it would be impossible to explain why many regions do not exhibit this phenomenon.
Even within China, this change is not uniform, so the explanation of “reducing tongue muscle effort” clearly does not fully account for the problem. In my view, the mainstream academic explanation of velar palatalization remains at a superficial level and does not address deeper causes, which amounts to no explanation at all. Without approaching this question from the perspectives of anatomy, human evolution, or even genetics, I believe any explanation is incomplete.
In fact, beyond the accents of certain regional dialects, a phenomenon similar to velar palatalization is Velar Fronting, which typically occurs during the early stages of human infancy and gradually disappears after the age of three. At this stage, infants, due to immature physiological development, weak control of oral tongue muscles, and incompletely developed laryngeal articulatory organs, find it very tiring to produce velar sounds such as k/g, which require the back of the tongue to lift backward and upward and precisely press against the velum, a task that is very difficult for an infant’s large, insufficiently flexible tongue. This ultimately leads to the fronting of k/g sounds, with the articulation place shifting toward the hard palate.
This is also why infants’ velar sounds (sounds produced by pressing the tongue against the velum, such as k/g) are typically replaced by alveolar sounds (sounds produced by pressing the tongue behind the upper teeth, such as t/d). In fact, there are many online posts about correcting infants’ inability to produce k/g sounds. The most common problem is pronouncing gēge (哥哥) as dēde (的的), gūgu (姑姑) as dūdu (嘟嘟), and gǒugǒu (狗狗) as dǒudou (抖抖). In English, this resembles pronouncing “Key” as “Tey”, “Goat” as “Doat”, “Cake” as “Take”, and “cup” as “tup”.
Attributing this systematic error to infants’ auditory deficits is certainly inaccurate. Modern medicine has long recognised that this condition arises because early control of tongue muscle articulation is not yet mature: velar sounds require precise control of contact between the posterior tongue and the velum, whereas anterior sounds involving the tongue tip are easier to control. At this stage, infants substitute “easier‑to‑produce sounds” for “sounds not yet mastered”. This condition generally resolves spontaneously after adulthood, and in most cases no deliberate correction of the infant is needed; it will naturally improve as the child grows.
However, research on infant pronunciation cannot explain why certain regional accents exhibit similar patterns, because language, including its pronunciation, should essentially be formed through gradual interaction among adults who already hold tribal power, rather than being determined by human infants who hold no tribal power at all. The logic must therefore be that infants, upon growing up, imitate the adults in their tribe, rather than that adults in the tribe deliberately reverse‑learn the pronunciation habits of human infants.
As mentioned earlier, the velar fronting phenomenon in infants occurs because the articulatory organs above the larynx are not yet fully developed, leading to a solution resembling velar palatalization. According to current academic research, there is another group whose articulatory organs resemble those of infants: Neanderthals.
Based on previous airway reconstruction studies of Neanderthal skeletal structure by cognitive scientist Philip Lieberman, and through computer‑programmed pronunciation simulation, he concluded that the articulatory organs above the larynx in Neanderthals resemble those of human infants. This may be because the foramen magnum in Neanderthals is typically positioned relatively posteriorly, possibly causing the head to tilt slightly forward, with a higher laryngeal position than modern humans. Consequently, the pharyngeal cavity is shortened, causing the tongue to be positioned too high and too far forward, almost entirely within the oral cavity rather than descending into the pharynx, with correspondingly reduced flexibility.
Therefore, when modern humans attempt to produce k/g sounds, they create a sudden, precise occlusion at the midpoint of the vocal tract, at the junction of the oral and pharyngeal cavities. Neanderthals, however, may have lacked the ability to contract the mid‑pharyngeal region, because the pharynx was too short and the tongue too high to form an occlusion at this critical position. Of course, Lieberman himself did not deny that Neanderthals could produce velar sounds such as k/g at all, a point misunderstood by many of his critics. His original meaning was closer to saying that, constrained by their special vocal tract structure of a short pharynx and high tongue position, Neanderthals found it more “difficult” to produce such sounds than modern humans, because they could not form precise, sudden occlusions in the vocal tract. This caused their attempts at k/g sounds to be more anterior and less stable, rendering them unusable in everyday continuous speech.
This is not to say that they could not occlude at the velum, but rather that the effort required was greater and more strenuous. They could barely produce sounds resembling k/g, but these did not support the clear, stable k/g sounds used in coherent speech in modern human language. Moreover, their k/g sounds would undergo fronting, resembling palatal sounds, that is, pre‑velar sounds, rather than velar sounds. This means that if a Neanderthal were asked to produce k/g sounds naturally, without forced correction, he might continue to maintain this fronting characteristic into adulthood. Thus, under natural conditions, Neanderthals would tend to front k/g sounds, or alternatively, as I mentioned earlier, directly undergo velar palatalization, pronouncing k/g as q/j.
Readers with a modicum of insight should realise that the “Neanderthals” I refer to here are clearly a metonym. Implicitly included are other archaic humans scattered across the world during the same period as Neanderthals, including of course Homo erectus. Their shared characteristic may have been a posteriorly positioned foramen magnum, a forward‑tilting head, and a correspondingly high laryngeal position, the only difference being that the condition in different groups may have been more standard or more severe, but the principle was the same. Populations that engaged in frequent gene exchange with local Homo erectus during the Palaeolithic may have inherited this vocal tract or cranial structure. Of course, I do not mean to suggest that the vocal tract structure of populations currently holding these pronunciation habits is necessarily archaic, but I can confirm that the accent, that is, the pronunciation habit, they inherited, when traced back to the original population that first produced these sounds, most likely did not produce k/g sounds very naturally. The auditory characteristics of failing to distinguish retroflex from non‑retroflex sibilants and of sounds being compressed forward are precisely the features of certain dialect accents.
Therefore, historically, certain words containing k/g sounds easily underwent changes in their original pronunciation due to alterations in the vocal tract of local populations. Among these, velar palatalization was the most severe: for example, the common transformation of k to q, as in Kujula, which should originally have been pronounced Kùjùlā (库俱拉) but is now pronounced Qiūjiùquè (丘就却). The same principle applies to Qiang: it originally could not possibly have been pronounced with a q sound as qiāng (羌), but should rather have been pronounced with a k sound. If transliterated into Chinese pronunciation, it would more closely resemble kāng (康). Therefore, Xīqiāng (西羌) should originally have been pronounced Xīkāng (西康), and Qiāngrén (羌人) should originally have been Kāngrén (康人), and vice versa. The Xikang Province (西康省) established during the Republican era could in fact be regarded as Xiqiang Province (西羌省).
Following this line of reasoning, one discovers that the two characters Kāngbā (康巴) directly mean “Qiang people”. In Khampa Tibetan, it is pronounced ཁམས་པ, with the Wylie transliteration khams‑pa. Here, ཁམས་པ, i.e. khams, means “Kham”, while བ, i.e. pa, means “person” or “person of a certain place” in Tibetan. Thus, Kham + pa together mean “people of the Kham region”. As I mentioned earlier, the original pronunciation of Qiang should have been Kang, and the pronunciation of Kang is closer to the true historical pronunciation of “Qiang”. Therefore, the direct meaning of Khampa is in fact “people of the Qiang region”, and Khampa plainly means “Qiang people”.
Viewed in this light, the “Khampa” populations of present‑day western Sichuan and eastern Tibet may, at least in nomenclature, be closer to the Qiang people recorded in history than the so‑called “Qiang ethnic group” in some modern ethnic classifications. The term “Qiang people” was a generic designation for numerous western tribes, but historically the vast majority of Qiang people continuously assimilated into Han Chinese and Tibetan populations. Before the modern Qiang ethnic group was formed as a unified ethnic identity, many populations today classified as Qiang did not generally self‑identify as “Qiang people”. However, “Kham” as a regional designation has a long history, so Khampa is not an ethnic name created in modern times, but rather a cultural identity based on the traditional regional division of Tibetan areas. Of course, “Khampa” as a broad regional cultural identity was also gradually strengthened in modern times.
Khampa, as a collective designation for Tibetans speaking the Khams dialect in the Kham region (khams), covers an area roughly corresponding to present‑day Qamdo, the eastern parts of Nagqu and Nyingchi in the Tibet Autonomous Region, Yushu Tibetan Autonomous Prefecture in Qinghai Province, Garzê Tibetan Autonomous Prefecture in Sichuan Province, and Dêqên Tibetan Autonomous Prefecture in Yunnan Province. According to research papers from various periods, as well as the statistics on paternal lineage proportions in Tibetan areas I mentioned in the main text, the overall frequency of D1a1‑F6251 in Qamdo, Nagqu and Nyingchi ranges from approximately 60–75 %, with D‑M533 as the main proportion plus a small amount of D‑Z27269.
Historically, Xi Qiang (西羌) was a generic term for scattered western nomadic peoples. As for the so‑called Qiang ethnic group in modern society, it has historically been continuously diluted by populations of other ethnic groups. Considering further that the vast majority of Qiang tribal branches historically continuously assimilated into Han territory, many Qiang people can no longer be verified through DNA in modern times. For example, D‑Z27269, particularly its downstream branch D‑F729, should historically have been the earliest eastward‑expanding and most deeply sinicised Qiang people. Therefore, rather than using some Qiang populations of unclear origin as samples for studying historical Qiang people, it is better to focus attention on the Khampa people of western Sichuan and eastern Tibet, those who self‑identify as “Khampa”, practised internal intermarriage until modern times, and carry a D‑P47 proportion of over 70 %.
Figure
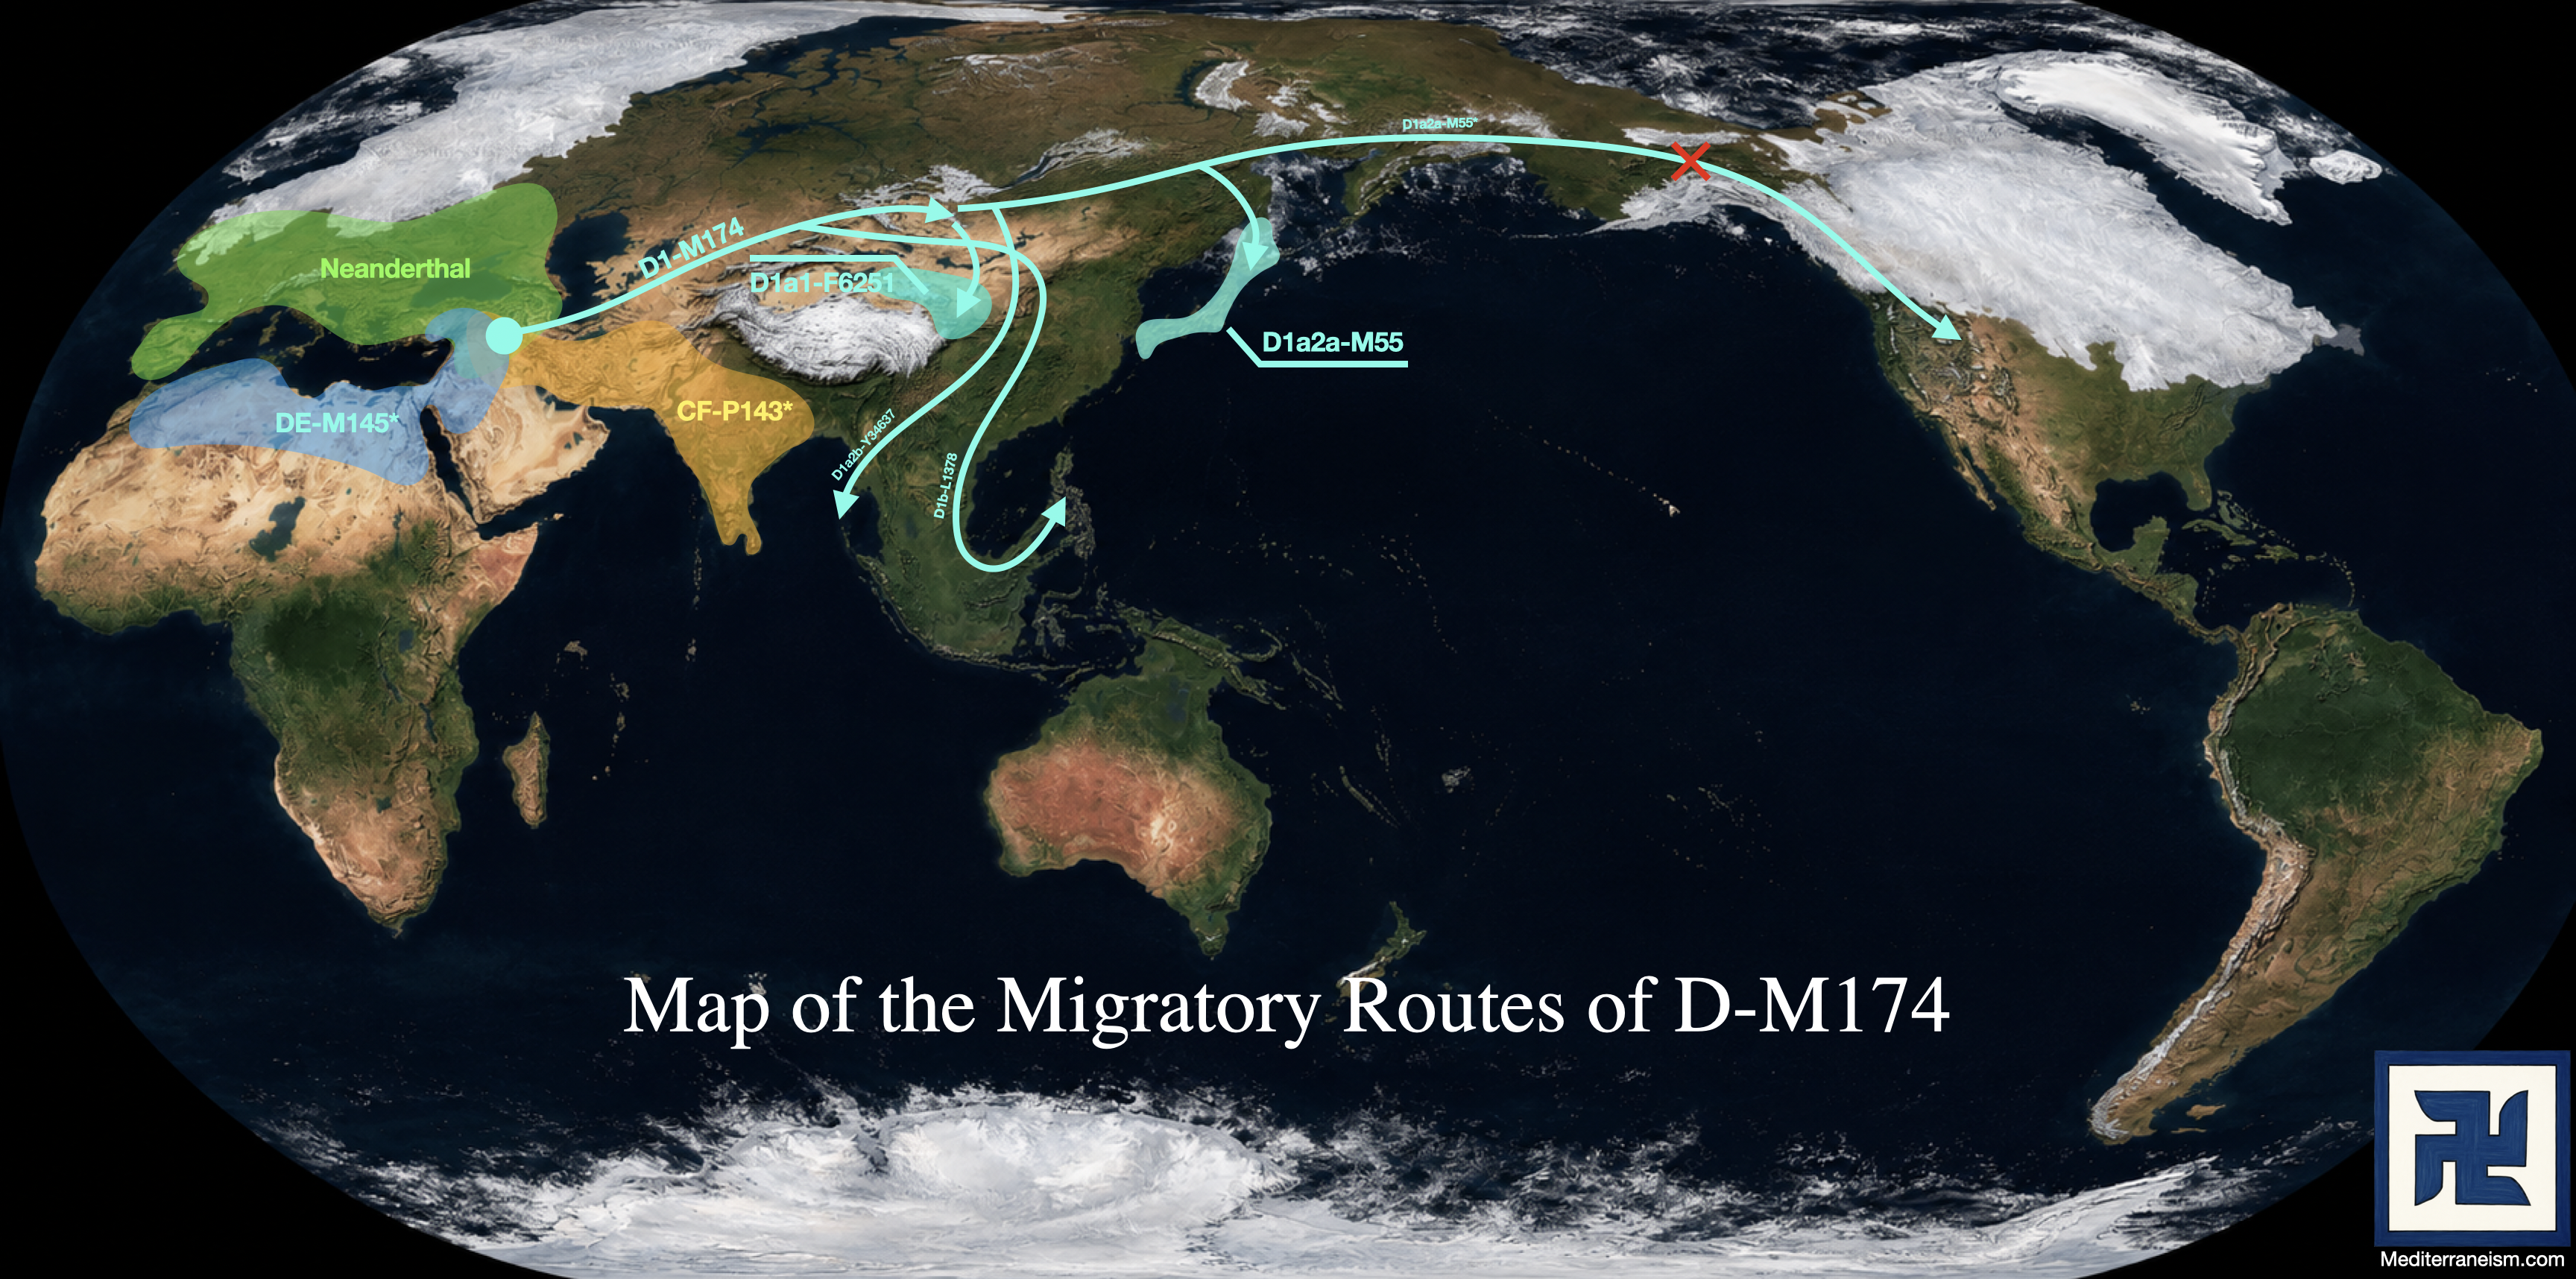
Map of the Migratory Routes of D-M174